
- Title
-
Insertional mutagenesis by the Tol2 transposon-mediated enhancer trap approach generated mutations in two developmental genes: tcf7 and synembryn-like
- Authors
- Nagayoshi, S., Hayashi, E., Abe, G., Osato, N., Asakawa, K., Urasaki, A., Horikawa, K., Ikeo, K., Takeda, H., and Kawakami, K.
- Source
- Full text @ Development

Expression patterns of genes at the integration sites. (A,C,E,G,I,K,M) Whole-mount in situ hybridization of embryos heterozygous for respective insertions (bottom right) at 24 hpf using the gfp probe. (B,D,F,H,J,L,N) Whole-mount in situ hybridization of wild-type embryos at 24 hpf using probes indicated (top right). Signals were detected in myotome (A,B), yolk (C,D), myotome (E-H), ventral mesoderm (I,J), myotome (K,L) and otic vesicle (M,N). |

The HG21C insertion disrupted the tcf7 gene. (A) The structure of the T2KHG insertion in the tcf7 gene. T2KHG is composed of Tol2 sequences (black), the zebrafish hsp70 promoter (orange), the GFP gene (green) and the SV40 polyA signal (purple). Exons (blue boxes) and 5′ UTR (white box) of the tcf7 gene are shown. Black arrows indicate positions and directions of primers. (B) Whole-mount in situ hybridization of an HG21C heterozygous embryo at 24 hpf using the gfp probe. (C) Whole-mount in situ hybridization of a wild-type embryo at 24 hpf using the tcf7 probe. (D-G) The median fin fold of HG21C embryos. Heterozygous (D,F) and homozygous (E,G) embryos at 60 hpf (D,E) and 72 hpf (F,G). (H) Summary of the linkage between the fin phenotype and the GFP expression. (I) Examples of the genotype analysis by PCR using tcf7-f2 and tcf7-r2 (top) and control PCR using tcf7-r2 and Tol2-OUT (bottom). M, DNA size marker; N, no DNA; P, positive control. (J) Summary of the genotype analysis. (K-R) Whole-mount in situ hybridization using the tcf7 probe. Wild-type embryos at 24 hpf (K) and 36 hpf (M), and HG21C homozygous embryos at 24 hpf (L) and 36 hpf (N). The pectoral fin buds of wild-type embryos at 36 hpf (O) and 48 hpf (Q), and HG21C homozygous embryos at 36 hpf (P) and 48 hpf (R). (S,T) The pectoral fins of 72 hpf heterozygous (S) and homozygous (T) HG21C embryos. (U,V) Microinjection of tcf7-MO. The pectoral fin (U) and the median fin (V) of MO-injected HG21 heterozygous embryos at 72 hpf. (W) Summary of the numbers of MO-injected embryos that showed abnormal median fin folds and pectoral fins. EXPRESSION / LABELING:
PHENOTYPE:
|

Roles of Tcf7 and Lef1 in the pectoral fin outgrowth. (A-C) Microinjection of lef1-MO into HG21C embryos. The pectoral fins of MO-injected heterozygous (A) and homozygous (B) embryos at 72 hpf. (C) Summary of the numbers of MO-injected embryos that showed an outgrown fin or reduced fin phenotype. (D-U) The pectoral fins of lef1-MO-injected wild-type and HG21C embryos analyzed by whole-mount in situ hybridization. The stages (28 hpf, 36 hpf, 38 hpf and 48 hpf) are shown on the top right. Wild-type (D-H,J,L,N,P,R), heterozygous (T) and homozygous (I,K,M,O,Q,S,U) embryos were used. The probes used are indicated (top right). EXPRESSION / LABELING:
PHENOTYPE:
|
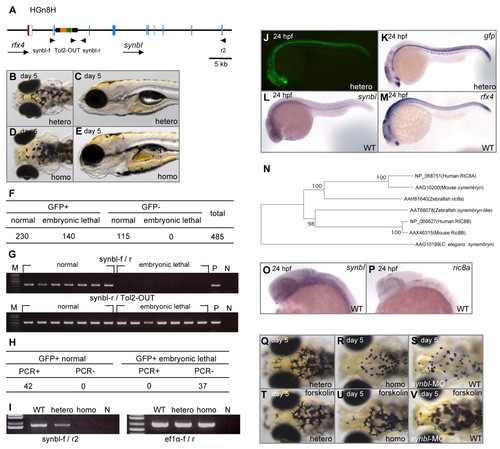
The HGn8H insertion disrupted the synembryn-like gene. (A) The structure of the T2KHG insertion in the synbl locus in the HG8H enhancer trap line. Arrowheads indicate positions and directions of primers. Blue and purple boxes indicate exons of the synbl and rfx4 genes, respectively. White boxes indicate 5′ and 3′ UTRs. (B-E) The pigment and edema phenotype in HGn8H embryos at day 5. Dorsal and side views of heterozygous (B,C) and homozygous (D,E) embryos. (F) Summary of the link between embryonic lethality and GFP expression. (G) Examples of the genotype analysis by PCR using synbl-f and synbl-r (top) and control PCR using r2 and Tol2-OUT (bottom). M, DNA size marker; N, no DNA; P, positive control. (H) Summary of the genotype analysis. (I) RT-PCR analysis of wild-type, heterozygous and homozygous embryos using synbl-f and r2 (left). Control RT-PCR using ef1α-f and ef1α-r primers (right). (J,K) GFP expression pattern in 24 hpf heterozygous embryos. GFP fluorescence (J) and whole-mount in situ hybridization using the gfp probe (K). (L,M) Whole-mount in situ hybridization of 24 hpf wild-type embryos using the synbl (L) and rfx4 (M) probes. (N) A phylogenic analysis of vertebrate synembryn homologs. (O,P) Whole-mount in situ hybridization of 24 hpf wild-type embryos using the synbl (O) and ric8a (P) probes. (Q-V) Rescue of the pigment phenotype by forskolin. Pigmentation of heterozygous (Q,T), homozygous (R,U) and synbl-MO-injected wild-type (S,V) embryos at day 5. Embryos were soaked in 1 μM (T,U) and 2 μM (V) forskolin. |

Unillustrated author statements |