
- Title
-
Ttrap is an essential modulator of Smad3-dependent Nodal signaling during zebrafish gastrulation and left-right axis determination
- Authors
- Esguerra, C.V., Nelles, L., Vermeire, L., Ibrahimi, A., Crawford, A.D., Derua, R., Janssens, E., Waelkens, E., Carmeliet, P., Collen, D., and Huylebroeck, D.
- Source
- Full text @ Development

Ttrap knockdown affects heart looping. Hearts were visualized via WISH for cmlc2 at 48 hpf. (A) Control embryo, normal heart looping. (B-D) TtrapMO embryos with reversed heart looping, no looping or cardia bifida. Arrowheads depict bilateral hearts in D. Frontal views; a, atrium; v, ventricle. |
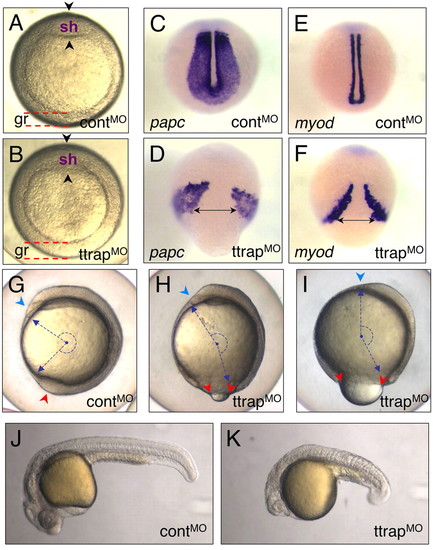
Ttrap knockdown with higher MO dose induces gastrulation defects. (A,B) TtrapMO embryos (B) with thickened germ ring at shield stage and a less distinct shield (arrowheads) than control (A). Animal views, dorsal on top (gr, germ ring; sh, shield). (C-F) ttrap is essential for CE movements. papc/myod-marked paraxial mesoderm cells fail to converge close to the midline in TtrapMO embryos (D,F). Dorsal-posterior views, tailbud stage. Double-headed arrows depict width between cells spanning the midline. (G-I) ttrap is required during epiboly. (G) Control embryo (3 ss) showing blastopore closure (red arrowhead) and normal head with polster (blue). (H,I) TtrapMO embryos (3 ss) showing varying degrees of severity with respect to epibolic movements. (H) TtrapMO embryo displaying mild epiboly defect (red arrowheads), which shows only slightly open blastopore and relatively normal head morphology with polster (blue). (I) TtrapMO embryo with more severe epiboly defect and larger open blastopore (red arrowheads). Downward spread of blastoderm cells only covers 80% of yolk cell; many of these embryos lyse shortly after; head region severely reduced in size with polster missing (blue arrowhead). The combination of CE and epiboly defects leads to severely truncated embryos. Blue dashed arrows and semi-circle depict embryo length and angle between anterior-posterior (AP) ends. Lateral views, dorsal to the right. (J,K) Live controlMO versus TtrapMO embryo, 24 hpf. The morphant embryo displays AP-axis truncation, microcephaly and micropthalmia. |
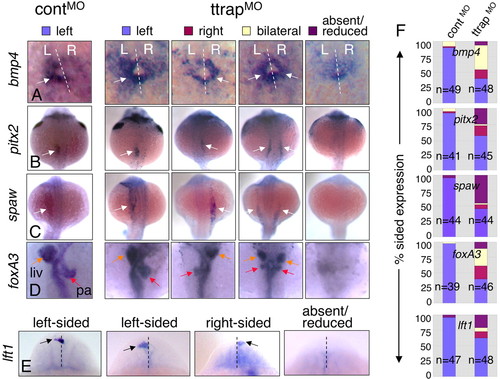
Randomized LR gene expression and organ laterality in TtrapMO embryos. (A-E) Left-sided, right-sided, bilateral or absent/reduced marker expression. For all panels, dorsal views, anterior at top; single arrows denote sidedness, double arrows bilateral expression. (A) bmp4 in cardiac primordium (22 ss). Dashed white line denotes midline (L, left; R, right). (B,C) pitx2 and spaw in LPM (22 ss). (D) foxA3, 48 hpf (orange arrow, liver, liv; red arrow, pancreas, pa). (E) lft1 in the diencephalon (22-24 ss). Dashed line indicates midline; arrows indicate the relevant altered expression domain. (F) Bar graphs showing percentage of embryos with sided expression of these markers within each phenotypic category (y-axis), in controlMO and TtrapMO embryos (x-axis). Blue bars, left-sided expression; red, right-sided; yellow, bilateral; purple, absent/reduced expression. n=total embryos from two experiments. EXPRESSION / LABELING:
PHENOTYPE:
|
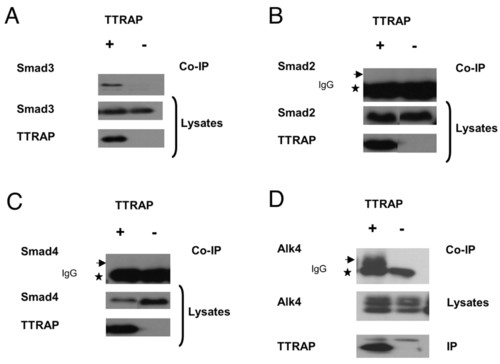
Ttrap associates with Smad3 and Alk4 in mammalian cells. (A-C) Co-immunoprecipitation of TTRAP with Smad3 but not Smad2/4. HA-tagged mouse Smad2, -3 or -4 were co-produced with Flag-TTRAP (+), or Flag-TTRAP-frameshift as control (-), in HEK293T cells and precipitated using anti-Flag antibody. Precipitates were immunoblotted and co-precipitated proteins detected with anti-Smad3 or anti-HA antibody for Smad2 or Smad4. Star indicates IgG and arrow shows lack of co-immunoprecipitation with Smad2/4. (D) TTRAP-Alk4 interaction. Myc-Alk4 and Flag-TTRAP (+) or control (-) were co-produced and precipitated using anti-Flag antibody. Precipitates were analyzed with anti-Myc (top panel). Star, IgG; arrow, co-immunoprecipitation of Alk4. |

ALK4 phosphorylates TTRAP. (A) SDS-PAGE showing in vitro phosphorylation of TTRAP (arrowhead) and ALK4 autophosphorylation (arrow), when incubated with [γ-32P]ATP and ALK4 kinase (+; - denotes no ALK4 added). (B) LC-MS/MS plot depicting in vitro phosphopeptides with T88(phos) and T92(phos). (C,D) Phospho-T88 and phospho-T92 are essential for Ttrap function. (C) mRNA injection, yielding overproduction of TTRAPT88A/T92A, is compatible with normal gastrulation. Live embryo at 80% epiboly showing normal germ ring (gr) and emerging dorsal axial structures (arrowhead). (D) Injection of TTRAPT88A/T92A is incapable of rescuing TtrapMO defects, as evidenced by thickened germ ring and lack of shield/axial structures. These embryos showed a severe delay in epiboly and appeared as if they had not passed germ ring stage even at 8 hpf (normally 80% epiboly). The defects observed in TtrapMO embryos were indistinguishable from TtrapMO+TTRAPT88A/T92A-injected embryos (not shown). Animal views, dorsal to the right. |
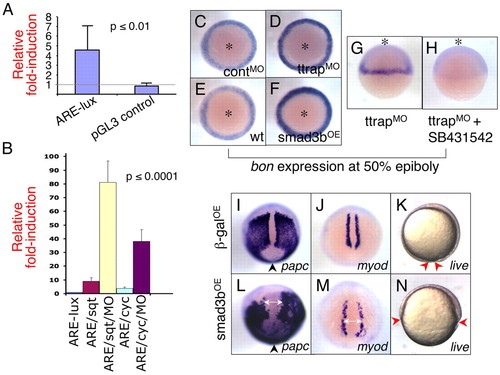
Ttrap knockdown modulates Nodal-Alk4 signaling. (A) Ttrap knockdown increases activity of ARE-luciferase reporter. ARE-lux plasmid (50 pg) was co-injected with TtrapMO (or controlMO) and embryo lysates assayed for luciferase at shield stage. Knockdown results in ∼fivefold greater induction relative to control (4.6±2.5; P≤0.01; Student's unpaired t-test; eight independent experiments). No significant increase in luciferase was detectable for control pGL3. (B) TtrapMO potentiates ARE-lux by sqt or cyc. This experiment was performed as described in A, this time in combination with sqt or cyc mRNA injection (11 pg). The addition of TtrapMO induced ARE-lux an additional tenfold relative to induction by either one of the ligands [81.0±15.6 (ARE+sqt+TtrapMO) vs 9.0±2.6 (ARE+sqt); 38.0±8.6 (ARE+cyc+TtrapMO) vs 3.8±0.8 (are+cyc); P≤0.0001, One-way analysis of variance (ANOVA)]. y-axis, fold-induction of luciferase. (C-F) bon is visibly upregulated in TtrapMO and Smad3bOE embryos; WISH at 50% epiboly, animal views (asterisks). (G,H) TtrapMO-mediated increase in bon expression depends on intact alk4 activity. (G) TtrapMO embryo shows strong expression of bon, whereas (H) TtrapMO embryo treated with SB431542 no longer expresses bon. Animal views (asterisks). (I-N) Overexpression of Smad3b causes CE and epiboly defects. WISH at 90% epiboly, paraxial mesoderm marker expression in βgalOE (700 pg) and Smad3bOE (700 pg) embryos. Dorsal-posterior views, anterior at top. (I,L) papc cells fail to converge near the midline in Smad3bOE embryos compared with control βgalOE embryos. Arrowheads indicate blastopore opening, which is wider in Smad3bOE embryos. (J,M) Distance between myod cells is greater in Smad3bOE relative to control embryos (double-headed arrows). (K,N) Live observation of β-galOE and Smad3bOE embryos, 90% epiboly. (K) Control β-galOE embryo displaying normal epiboly and nearing blastopore closure. (N) Smad3bOE embryo showing severe delay in epiboly. Red arrowheads, edge of blastoderm margin. Lateral views, anterior at top. Note that the gastrulation defects depicted here are at an earlier timepoint than those shown for TtrapMO embryos (see Fig. 2). Importantly however, the same gastrulation defects were also observed for TtrapMO embryos at this earlier stage (i.e. 90% epiboly). EXPRESSION / LABELING:
|

Double Ttrap and Smad3b knockdown rescues CE defect in Ttrap knockdown. myod marks paraxial/adaxial mesoderm (8 ss). (A) Broadened somites and a wide distance between myod cells in Ttrap single knockdown embryo. (B) A combination of 16 ng TtrapMO and 1 ng Smad3bMO shows closer convergence of myod cells at midline. However, somitic expression is still broad relative to the fully rescued embryo co-injected with 2 ng Smad3bMO (C), which now displays the normal myod domain. Dorsal views, anterior at top. EXPRESSION / LABELING:
|
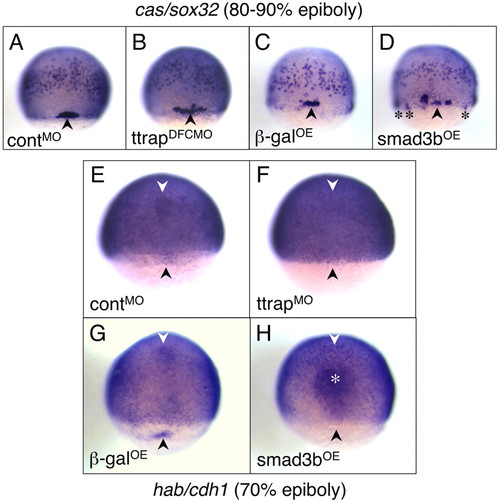
Aberrant DFC migration and clustering as a result of Ttrap-Smad3-mediated downregulation of cdh1. (A-D) cas/sox32 as DFC marker, 80-90% epiboly. (A,C) Tight clustering of DFCs (black arrowheads) in controlMO and βgalOE embryos. (B,D) In TtrapMO and Smad3bOE embryos, DFCs are more spread out. Occasionally, DFCs are also ectopically located around and just underneath the blastoderm margin (black asterisks). (E-H) cdh1 is absent in DFCs and anterior axial hypoblast of TtrapMO and Smad3bOE embryos, 70% epiboly. General cdh1 expression in the epiblast remains unaltered in all embryos; the embryos are deliberately overstained. (E,G) cdh1 in DFCs (black arrowheads) and anterior axial hypoblast (white arrowheads) visible in controlMO and βgalOE embryos and missing in (F) TtrapMO and (H) Smad3bOE embryos. In Smad3bOE embryos, stronger staining in the prechordal plate (white asterisk) was also observed and may be a consequence of a thickening of this region because of hyperdorsalization. Dorsal views, anterior at top. EXPRESSION / LABELING:
PHENOTYPE:
|

Knockdown of Ttrap induces ectopic snai1a in the shield and DFCs. (A-D) WISH for snai1a, 60% epiboly. (A,B) snai1a transcripts are found in the margin and paraxial mesoderm in TtrapMO embryos, but are also present ectopically in the presumptive axial mesodermal region within the shield (red arrowheads and arrows). (C,D) Rescued Ttrap and Smad3b MO double-knockdown embryos display normal snai1a domain, particularly, the exclusion of snai1a from the shield (black arrowhead and arrows). Dorsal views, anterior at top. (E) Derepression of snai1a in axial mesoderm of TtrapMO embryos is mediated by Smad3. Graph depicts partial rescue of TtrapMO-induced snai1a phenotype in Ttrap and Smad3 double knockdowns. y-axis represents percentage of embryos exhibiting either snai1a exclusion from axial mesoderm (purple bars) or ectopic expression in axial mesoderm (blue bars), at 60% epiboly. x-axis represents types of MO treatment. 81% of TtrapMO embryos display abnormal snai1a domain, whereas simultaneous knockdown of Ttrap and Smad3 reverts up to 58% of these embryos back to the wild-type domain (purple bars). EXPRESSION / LABELING:
|
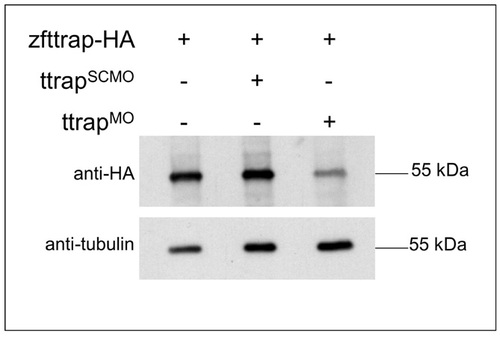
Translational inhibition of Ttrap protein by Ttrap MO. Western blot analysis of HA-tagged zebrafish Ttrap, either alone (left lane), after co-injection with scrambled control MO (SCMO) (middle lane), or after co-injection with TtrapMO (1:1 mix of Ttrap MO1 and Ttrap MO2 (16 ng total), as used throughout this study) (right lane). Since none of the available antibodies against mammalian Ttrap were capable of detecting zebrafish Ttrap in vivo, we resorted to mRNA overexpresssion of full-length, HA-tagged zebrafish Ttrap (zfTtrap-HA) in fish embryos. Western blot analysis using an anti-HA antibody resulted in a single band of 55 kDa which is clearly downregulated in TtrapMO embryos. An anti-tubulin antibody was used to control for input and loading. |

Test for functionality and expression of mutant and wild-type human TTRAP in zebrafish embryos. (A) Co-IP of Smad3 with TTRAP or TTRAPT88A,T92A. TTRAP-pCS3 or TTRAPT88A,T92A-pCS3 were co-expressed with HA-tagged Smad3 or Flag-tagged TTRAP-frame-shift as control in HEK293T cells and co-immunoprecipitated using anti-HA antibody. The precipitates were immunoblotted and proteins detected with monoclonal anti-HA (middle panel) or monoclonal anti-TTRAP antibody (top and bottom panel). (B) Western blot analysis of TTRAP and TTRAPT88A,T92A expression in zebrafish embryos. Total protein of zebrafish embryos injected with TTRAP-pCS2 or TTRAPT88A,T92A-pCS2 mRNA was isolated 2 hours, 4 hours and 6 hours after injection and incubated with TTRAP antibody to check expression levels. An anti-tubulin antibody was used to control for input and loading. |
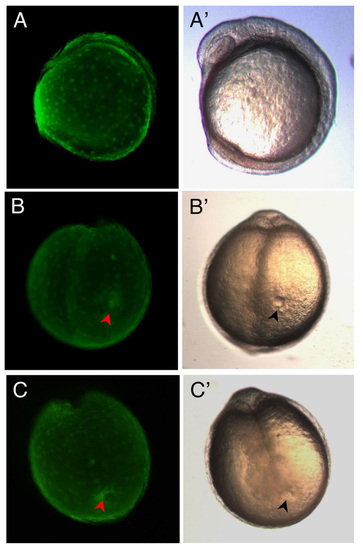
Targeting of eGFP mRNA to DFCs and expression in Kupffer’s Vesicle. (A-C, A′-C′) Live embryos at 7-somite stage. (A-C) Fluorescence images of eGFPDFCOE embryos showing eGFP expression only in the yolk and KV and not in the rest of the embryo. (A′-C′) Corresponding transmitted light images of embryos in A-C. (B) Occasionally, eGFP could be found filling the entire KV (red arrowhead), whereas in the majority of embryos, such as in (C), eGFP only outlines part of the KV (red arrowhead), implying that only a subset of DFCs take up and/or express eGFP RNA/protein. Embryos in (B′ and C′) showing fully formed KV (black arrowheads). All eGFPDFCOE embryos (n=160) developed normally. (A and A′) Lateral view. (B, B′, C, and C′) Posterior views. |
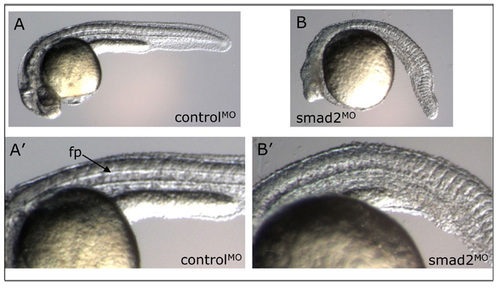
Smad2 morpholino knockdown phenotype. Live observation of controlMO or Smad2MO embryos at 30 hpf. (A,A′) Embryo injected with standard fluorescent control morpholino possesses normal morphology and clearly visible floorplate (fp, arrow). (B,B′) Smad2 morpholino-treated embryo displays anterior truncations, a curved shortened body axis, and absence of floorplate. This phenotype was observed at 4 ng and 8 ng MO doses. Lateral views, anterior to the left, dorsal at top. PHENOTYPE:
|
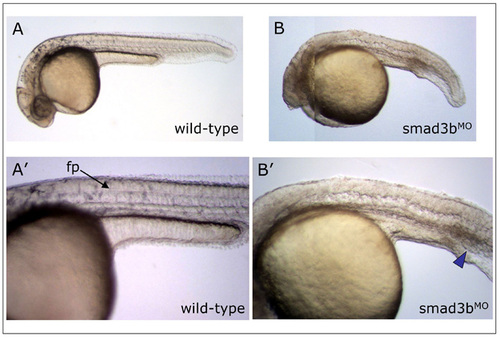
Smad3b morpholino knockdown phenotype. Live observation of controlMO or Smad3bMO embryos at 30 hpf. (A,A′) Wild-type embryo possesses normal morphology and clearly visible floorplate (fp, arrow). (B,B′) Smad3b morpholino-treated embryo displays anterior truncations, a curved shortened body axis, absence of floorplate, and a slightly enlarged intermediate cell mass (ICM, blue arrowhead), the latter phenotype indicative of partial ventralization. This phenotype was observed at 4 ng and 8 ng MO doses. Lateral views, anterior to the left, dorsal at top. Note: embryo in (B) is a composite photo to show all structures of embryo in focus. PHENOTYPE:
|

Behavior of TtrapMO cells in maternal-zygotic one-eyed pinhead (MZoep) embryos. A total of 23 MZoep embryos were transplanted with a mix of wild-type and TtrapMO cells. Wild-type embryos were pre-labeled at the one-cell stage with either Alexa Fluor 568 dye (red fluorescence; Invitrogen), or with fluorescein-labeled Ttrap MO (green fluorescence; Genetools). In all 23 cases, TtrapMO cells failed to internalize. Left panels (bright field), middle panels (rhodamine filter), right panels (GFP filter). Time-course begins approximately at germ ring to shield stage (5.5 to 6 hpf), and ends at around late tailbud to 1- to 3-somite stage (10.5 to 11 hpf). (A,B) Representative time-lapse images of wild-type vs TtrapMO cell migration in an MZoep background. Green arrows indicate wild-type cells in region of endodermal progenitors and in a deeper cell layer and are therefore in a different focal plane, hence becoming more and more out of focus over the course of the time-lapse study. Red arrows indicate TtrapMO cells, which, like MZoep (or oep) cells fail to involute and remain at the surface, accumulating at the vegetal-dorsal thickening (black arrow), but not in the neighboring endodermal progenitor regions. All embryos oriented with dorsal side to the right. MZoep embryos were obtained from a homozygous cross of parental fish generated from an oep t357/ t357 incross followed by cripto rescue. Digital images were captured using the Lumar V12 and AxioCam MRc5 and the images processed using Axiovision 4.5 Software (Zeiss). Cell transplantations were carried out using a Cell Tram Vario (Eppendorf). |
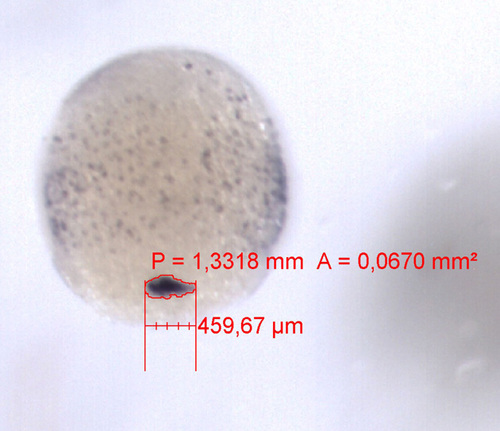
Comparative quantification of DFC number and domain width along lateral margin between TtrapMO and controlMO embryos. Embryos were microinjected with either Ttrap MO or scrambled control MO and fixed with 4% PFA at shield, 70-80% epiboly and bud stages. DFCs were visualized via whole-mount in situ hybridization using sox32/casanova as a probe. Cell counts were performed manually using a 200× magnification of the DFC stained region. Widths of DFC sox32/cas expression domains were obtained and recorded by measuring the points between the outermost cells. Photographs and measurements of each embryo were taken using a Deltapix digital camera and the annotations function of the DpxView Pro Image Management Software (Deltapix AS, Denmark; see example of screen capture image below) respectively. Note: embryos are somewhat wider in diameter (approx. 1-1.2 mm) than live equivalent, most likely due to processing during in situ hybridization and the final rehydration process after clearing. Zoom factor in program also results in final width measurement that is 1.75× greater than actual sample. However, this zoom factor was taken into account when calculating final distances. |

Unillustrated author statements |