
- Title
-
Zebrafish cdc25a is expressed during early development and limiting for post-blastoderm cell cycle progression
- Authors
- Nogare, D.E., Arguello, A., Sazer, S., and Lane, M.E.
- Source
- Full text @ Dev. Dyn.

Rescue of the cdc25-22 mutation in S. pombe by various cdc25 constructs. All experiments were performed in the cdc25-22 background. Growth conditions are indicated at left and all genes expressed from the nmt1 promoter are noted above. |
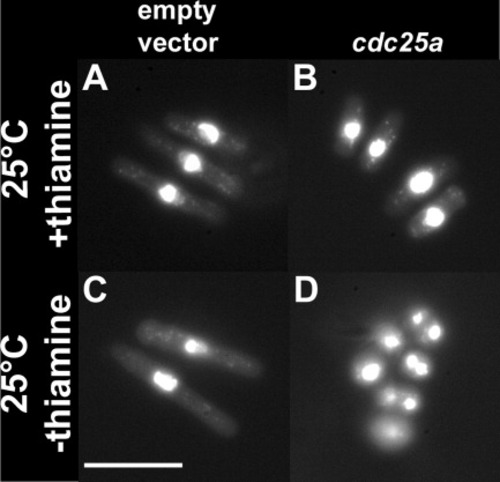
Morphology of fixed DAPI-stained S. pombe cdc25-22 cells transformed with cdc25a or empty vector. Growth conditions are as indicated at left; all panels are to same scale. Scale bar = 10 μm. |
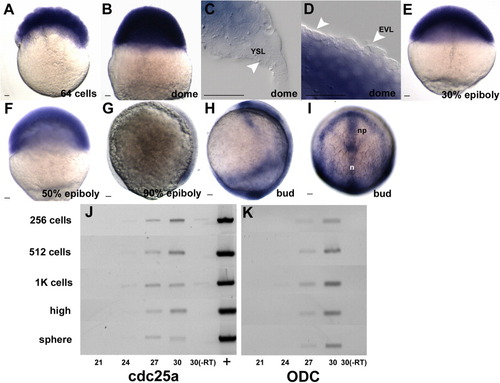
In situ hybridization using a cdc25a antisense probe during epiboly. Represented are staged semi-quantitative RT-PCR results using either cdc25a (j) or ODC (k) specific primers. Cycle numbers are as indicated below panels, with stages at left. (+) plasmid positive control; (-RT) no RT control reactions. All embryos are oriented animal pole up. g and h are lateral views with the dorsal side to the right and i is a dorsal view. YSL, yolk syncytial layer; EVL, enveloping layer; n, notochord; np, neural plate. Scale bar = 20 μm. |
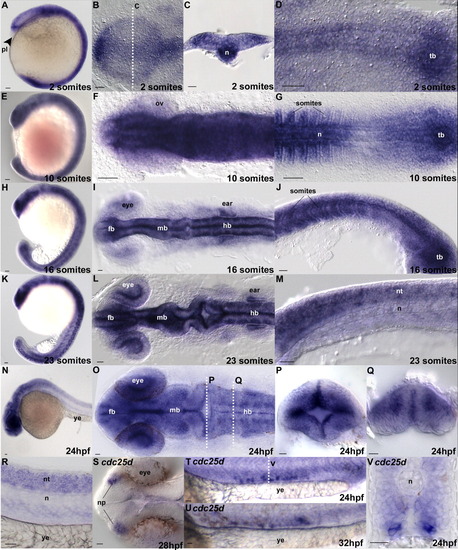
In situ hybridization using cdc25a (a-r) and cdc25d (s-v) antisense probes. Stages are indicated in the lower left of each panel. p and q are cross-sections through a 24hpf embryo at the positions labeled in l o. v is a section as indicated in t. Anatomical structures, where appropriate for orientation, are labeled. Embryo orientations are as follows: a, e, h, and k are lateral views. b, f, I, l, o, and s are dorsal views of the anterior regions of the embryo, anteriormost to the left. d, g are similarly oriented but focused on the posterior region of the embryo. j, m, n, r, t, and u are lateral views. Cross-sections c, p, q, and v are dorsal up. tb, tailbud; n, notochord; pl, polster; fb, forebrain; mb, midbrain; hb, hindbrain; ov, optic vesicle; ye, yolk extension; nt, neural tube; np, nasal placodes. Scale bar = 20 μm. EXPRESSION / LABELING:
|
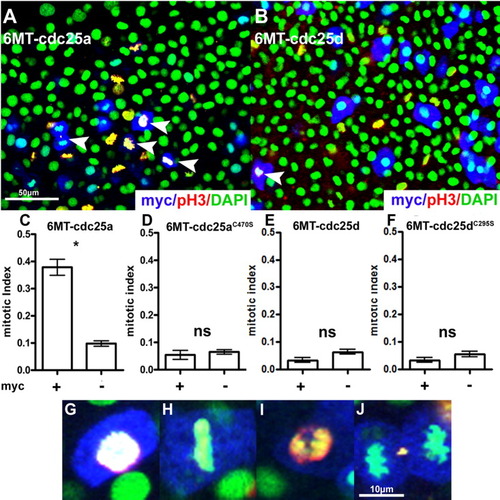
Overexpression of cdc25a and cdc25d in gastrulating zebrafish embryos. a,b: Example fields from either cdc25a or cdc25d expressing embryos following heatshock and staining. c-f: Mitotic index quantification. *P <0.01; ns, not significant. For cdc25a, n = 14 fields, and for cdc25d, n = 8 fields. See Experimental Procedures for details. g-j: Enlarged images of cdc25a expressing (myc+) cells in various phases of mitosis. Stains are as indicated in the lower right of a and b. White arrowheads in a and b indicate Myc-positive (therefore cdc25-positive) mitotic figures. |