
- Title
-
A zebrafish LMO4 ortholog limits the size of the forebrain and eyes through negative regulation of six3b and rx3
- Authors
- McCollum, C.W., Amin, S.R., Pauerstein, P., and Lane, M.E.
- Source
- Full text @ Dev. Biol.
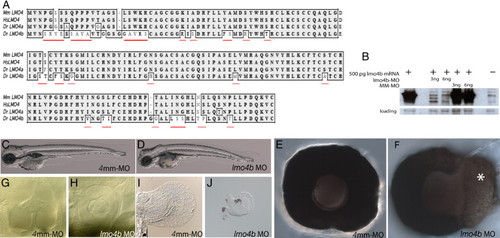
Zebrafish lmo4b is essential for viability and eye, ear and pectoral fin development. (A) Alignment of amino acid sequence alignment of zebrafish (Dr.) Lmo4b (Accession #NP817093) with mouse (Mm.; Accession #NM010723.1), human (Hs.; Accession #NM006769.2) and zebrafish (Dr.) Lmo4a (Accession #AAN03596). Residues unique to Lmo4b are underlined in red. (B) Western blot of extracts from embryos injected with 500 pg of 6xmyc-lmo4b mRNA and a mixture of two non-overlapping translational-blocking MOs or a 4 mm control MO, probed with anti-myc antibody. An unrelated immunoreactive band present in all extracts demonstrates comparable loading for all lanes. (C–J) 72 hpf larvae or larval tissue from embryos injected with 4 ng of either 4 mm-MO (C, E, G, I) or 4 ng of lmo4b-MO (D, F, H, J). High magnification views of morphant eyes reveal retinal enlargement (F) and defects in the ear (G, H) and pectoral fins (I, J). PHENOTYPE:
|
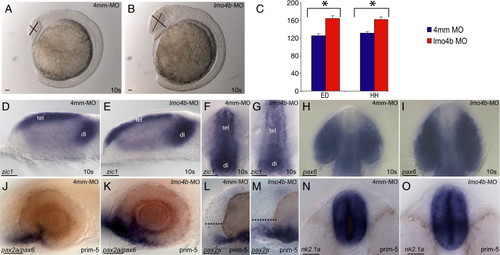
Loss of lmo4b causes forebrain and eye enlargement. (A, B) Lateral view of 10-somite embryos injected with 4 ng of 4 mm-MO (A) and 4 ng of lmo4b-MO (B). (C) Quantitative representation of eye diameter (ED) and head height (HH) measurements of embryos injected with 4 mm-MO (blue) and lmo4b-MO (red). Error bars represent standard error of the mean (S.E.M.). Values in μm with confidence intervals for head height are 131 ± 8 for control injections and 162 ± 12 for morphants, and for eye diameter are 125 ± 10 for control injections and 164 ± 12 for morphants. For HH p = 8.7 x 10- 5, for ED p = 2.2 x 10- 5. (D–O) Whole mount views of embryos injected with 4 mm-MO (D, F, H, J, L, N) and lmo4b-MO (E, G, I, K, M, O) show size differences in the forebrain and eyes. Panels D, E, and J–M are lateral views. Panels F–I are dorsal views of the anterior region, and panels N, O are ventral views of the anterior. The dashed lines in panels L, M represent pre-optic area. tel = telencephalon; di = diencephalon. Scale bars are 20 μm. EXPRESSION / LABELING:
PHENOTYPE:
|

Neural tube closure and dorsoventral patterning are normal in lmo4b morphant embryos. Panels A–D are cross sections through the anterior neural rod (A, B) or neural tube (C, D) in the region of the forebrain from control (A, C) and morphant (B, D) embryos. In situ hybridization probes used to localize forebrain tissue indicated at the left. (E, F) Bud stage embryos stained with probes to indicate the size of the anterior neural plate. |

Loss of lmo4b expands the anterior neural plate. (A, B) Lateral views of embryos at the 10s stage stained with the regional markers zic1, pax2a and krox20 to delineate regions that are measured and compared between control-injected (A) and morphant (B) embryos. (C) Measurements are normalized to the size of rhombomeres 3–5 (region d). Bars indicate standard error of the mean. Statistically significant differences are indicated with an asterisk. Individual values, with confidence intervals, for control (blue) and morphant (red) respectively are: a/d = 4.6 ± 0.3 and 5.2 ± 0.3; b/d = 1.4 ± 0.1 and 1.5 ± 0.1; c/d = 1.9 ± 0.01 and 1.8 ± 0.1. p values are indicated in the text. (D–F) Dorsal views of the anterior neural plate of embryos at the 1s stage, stained for expression lmo4b (blue) and zic1 (red) (D, E) or lmo4b alone (F) to mark the neural plate (np), neural boundary and non-neural ectoderm (nne). Panel E is an enlargement of the region indicated by the box in panels D and F is a similarly enlarged region from a different embryo. Panels G, H are cross-sections through the anterior neural region of wild type embryos at the 3s (G) and 6s (H) stages. Arrowheads indicate non-neural ectoderm. Panels I–K are dorsal views of the anterior neural plate stained for zic1 expression in embryos injected with 4 mm-MO (I), lmo4b-MO (J) or 750 pg lmo4b mRNA (K) at the 2s stage. Scale bars are 20 μm. EXPRESSION / LABELING:
PHENOTYPE:
|

Dosage sensitive negative regulation of six3 and rx3 by lmo4b. All panels are dorsal view of the anterior neural region at the 3s stage. Embryos injected with lmo4b MO (A, B, F, G) control MO (C, H) or lmo4b mRNA (D, E, I, J) as labeled. Scale bars are 20 μm. EXPRESSION / LABELING:
PHENOTYPE:
|

Loss of lmo4b results in higher average total cell nuclei and mitotic cell counts in the optic vesicle. Panels A–D are dorsoanterior views of 7s stage embryos injected with 4 ng of 4 mm-MO (A, C) and 4 ng of lmo4b-MO (B, D). Panels E-G are graphical representations of average total cell nuclei count (E), average total mitotic cell count (F) and average mitotic index (G) per optic vesicle. Individual values with confidence intervals for control and morphants, respectively are: E = 877 ± 14 and 1410 ± 30. F = 20 ± 1 and 58 ± 1. G = 2.3 x 10- 2±1.1 x 10- 3 and 2.6 x 10- 2±1.3 x 10- 3. p values are indicated in the text. n of lmo4b morphant optic vesicles = 13; n of control optic vesicles = 6. Error bars represent S.E.M. PHENOTYPE:
|
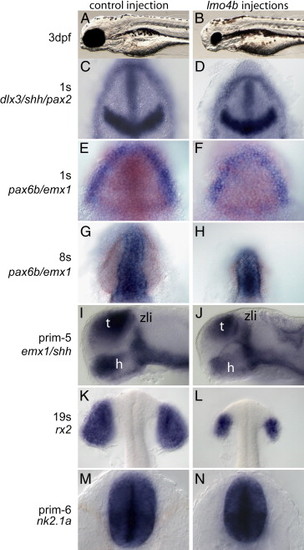
Overexpression of lmo4b reduces telencephalon and eye size. Embryos in the left were injected with 750 pg gfp mRNA, and embryos on the right were injected with 750 pg lmo4b mRNA. Probes and stages indicated on the far left. (A, B) Lateral views of 3 dpf larvae. Panels C–H, K, L are dorsal views of the anterior region. In panels E–H, emx1 staining is blue and pax6b staining is orange. Panels I, J are lateral views of the anterior region. Panels M, N are ventral views. zli-zona limitans intrathalamica; h = hypothalamus. t = telencephalon. EXPRESSION / LABELING:
|

lmo4b overexpression modifies six3 gain and loss of function phenotypes. Embryos injected with lmo4b mRNA and six3 MO (A–F) or six3 mRNA (G–O) as indicated in each panel, and stained by in situ hybridization as indicated in far left column. (A–C) and (G–I) are lateral views, (D–F) and (J–O) are dorsal views of the anterior neural tissue. Figures in each row are taken at the same magnification. Scale bar in all panels is 20 μ. EXPRESSION / LABELING:
|
Reprinted from Developmental Biology, 309(2), McCollum, C.W., Amin, S.R., Pauerstein, P., and Lane, M.E., A zebrafish LMO4 ortholog limits the size of the forebrain and eyes through negative regulation of six3b and rx3, 373-385, Copyright (2007) with permission from Elsevier. Full text @ Dev. Biol.