
- Title
-
Wnt/Axin1/beta-Catenin Signaling Regulates Asymmetric Nodal Activation, Elaboration, and Concordance of CNS Asymmetries
- Authors
- Carl, M., Bianco, I.H., Bajoghli, B., Aghaallaei, N., Czerny, T., and Wilson, S.W.
- Source
- Full text @ Neuron
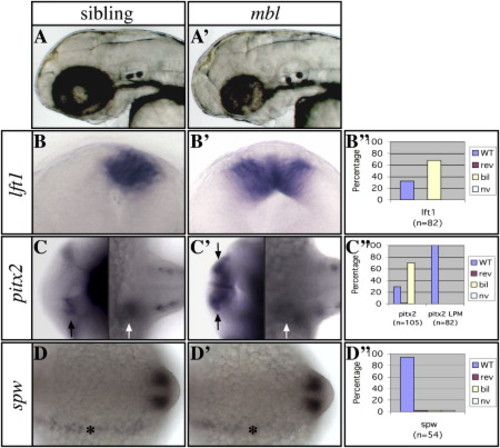
The mbl Mutation in axin1 Causes Brain-Specific Loss of Asymmetric Nodal Pathway Gene Expression (A and A′) Lateral views of the head with anterior to the left of 2-day-old living wild-type (left) and mbl mutant (right) embryos. (B and B′) Frontal views of the epithalamus (dorsal to the top) of 24s stage wild-type and mbl embryos. (C and C′) Dorsal views of the brain (left) and trunk LPM (right) of 24s stage wild-type and mbl embryos with anterior to the left. (D and D′) Dorsal views of the trunk LPM of 14s stage wild-type and mbl embryos with anterior to the left. The markers used to assess asymmetries are indicated to the left of the panels. (B″–D″) Graphs illustrate the percentage of mbl embryos with wild-type (WT) left, reversed (rev) right, bilateral (bil), or not visible (nv) Nodal pathway gene expression (see also Table S1). Note the loss of asymmetry in Nodal pathway gene expression in the epithalamus ([B], [B′], and black arrows in [C] and [C′]), but not the lateral plate mesoderm (LPM; white arrows in [C] and [C′] and asterisks in [D] and [D′]) in mutants. The expression analysis of lft1 and pitx2 in all figures refers to expression in the brain, unless indicated otherwise. EXPRESSION / LABELING:
PHENOTYPE:
|

The mbl Mutation Can Activate Epithalamic Nodal Pathway Genes Epistatic to Loss of Spw Activity (A) The graph illustrates the percentage of embryos with wild-type (WT) left, reversed (rev) right, bilateral (bil), or not visible (nv) Nodal pathway gene expression in the epithalamus of wild-type (mbl sib) mbl (mbltm213/tm213), spw morphant (MoSpw/mbl sib), and mbl;spw morphant (MoSpw/mbl) embryos. The knockdown of Spw function results in the absence of lft1 and pitx2 expression only in the presence of wild-type Axin1. (B–E) Frontal views of the epithalamus (dorsal to the top) of 24s stage wild-type (mbl sib) mbl, spw morphant (MoSpw/mbl sib), and mbl;spw morphant (MoSpw/mbl) embryos analyzed for lft1 expression. EXPRESSION / LABELING:
PHENOTYPE:
|

Manipulating Wnt Signaling during Mid-Somite Stages Disrupts the Laterality of Nodal Pathway Expression in Both LPM and Brain (A, H, K, and N) Graphs illustrate the percentage of embryos with wild-type (WT) left, reversed (rev) right, bilateral (bil), or not visible (nv) Nodal pathway gene expression (see also Tables S2 and S3). (A) Zebrafish embryos were treated with lithium chloride (LiCl) at the stages indicated and analyzed for Nodal pathway gene expression in the brain (and LPM in [H]) at 24s stage (see also Experimental Procedures). (B–G) Dorsal views of the (B, D, and F) brain and (C, E, and G) trunk LPM of 24s stage wild-type and mbl embryos, with anterior to the left analyzed for pitx2 expression. The arrows indicate the sites of pitx2 expression (epithalamus in [B], [D], and [F]; LPM in [C], [E], and [G]). (B–E) LiCl treatment of embryos at 80% epiboly results in the loss of pitx2 asymmetry in the brain alone, whereas (F–H) treatments at 14 somite stage result in disruption of expression concordantly in brain and LPM. (I, J, L, and M) Dorsal views of medaka embryos (anterior to the top, stages are indicated at the bottom left of each panel) showing (I and J) lft expression in the epithalamus and (L and M) spw expression in the LPM. Heat shock treatments were performed at 4s stage (I and J) and at 2s stage (L and M). Heat shock activation of (J and M) wnt1 in Tg(HS:GFP, HS:wnt1) transgenic medaka embryos causes bilateral Nodal pathway gene expression in the CNS and LPM (K and N). (K and N) Heat shock of wild-type embryos had no effect on lft or spw expression. EXPRESSION / LABELING:
PHENOTYPE:
|

mbl Mutants Have Parapineal Migration Defects and Bilaterally Symmetric Habenulae (A–H and A′–H′) Dorsal or frontal views of the epithalamus (anterior to the top) of (A, A′, D, and D′) 2-day-, (B and B′) 2.5-day-, (F and F′) 3-day-, and (E, E′, G, G′, H, and H′) 4-day-old wild-type and mbl mutant embryos. All markers used in the panels are indicated on the left (the text color matches the expression domain color in double labelings). (A–A″ and C) gfi is expressed exclusively in the parapineal (midline is indicated by the red dotted line). Of the two mbl embryos shown, one shows normally migrated parapineal cells, and the other shows parapineal cells at the midline. (B and B′) Embryos carried a foxD3:GFP transgene [mbltm213 x Tg(foxD3:GFP)]. Double labeling shows that, even in the presence of migrating parapineal cells, lov gene expression remains low in the left habenula of the mutant (B′). (H and H′) The arrows mark the neuropil of the medial left habenula, which is reduced in the mbl mutant. (I and I′) Dorsal views of 3D reconstructions of confocal images of habenular axon terminals in the target IPN nucleus labeled with lipophilic dyes as indicated. (A″ and D″–H″) Graphs illustrate the percentage of embryos with wild-type (WT) left, reversed (rev) right, medial (med), bilateral (bil), or not visible (nv) gene expression or neuropil formation. Bilateral right (bil-right) indicates that both habenulae exhibit the profile of gene expression or neuropil formation characteristic for the right habenula of wild-type embryos. The graph in (I″) shows that in nearly all mbl embryos the axonal projections coming from the habenulae intermingle in the ventral IPN. |

Epithalamic Asymmetries Are Largely Uncoupled in mbl Embryos (A–P) Dorsal views of (A–L) 4-day-old embryos derived from a mbltm213 x Tg(foxD3:GFP);Tg(lft1:GFP) incross were analyzed for (A, D, G, and J) parapineal migration and projections. The labeling performed and the genotype of the embryos analyzed are indicated on the left and at the top, respectively. (A, D, G, J, M, and N) White arrows mark parapineal projections toward the left or right habenula; pineal cells are pseudocolored in blue. (B, E, H, and K) Axonal projections into the IPN and (C, F, I, and L) lov gene expression (overdeveloped, black arrows mark the side of slightly more intense lov gene expression). The habenulae of all mbl embryos exhibit the projection pattern characteristic for the right habenula, irrrespective of parapineal projections. (M–P) The onset ([M and N]; arrowheads) and targeting (O and P) of parapineal projections is superficially normal in the mbl embryos, irrespective of the migration of parapineal cells. The pineal cells are pseudocolored blue. EXPRESSION / LABELING:
|

Manipulations that disrupt early Wnt pathway activity result in loss of asymmetry of Nodal pathway gene expression in the LPM and brain and heterotaxia phenotypes (A-F) The panels show wild-type expression of genes as indicated on the left. (A′-F′) To illustrate the effect of manipulation of Wnt signalling, the panels show the expression of the same genes in wnt8b injected embryos. (A,A′) Frontal views of the epithalamus and (B,B′) dorsal views of 24s stage embryos. Red dotted line indicates the midline, black arrows point at pitx2 expression in the epithalamus (et) and white arrows at pitx2 expression in the lateral plate mesoderm (LPM). (C,C′,D,D′) Dorsal views of the epithalamus at (C,C′) 2 days and (D,D′) 4 days of development. (E,E′) Dorsal and (F,F′) frontal views of 2 days old embryos. The yellow dotted line outlines (E,E′) the embryo and (F,F′) the heart. (A″-F″) The graphs illustrate the percentage of embryos with wild-type (WT) left, reversed (rev) right, bilateral (bil), medial (med) or not visible (nv) gene expression upon activation of the Wnt signalling pathway. lhab, left habenula; pp, parapineal; rhab, right habenula. EXPRESSION / LABELING:
|
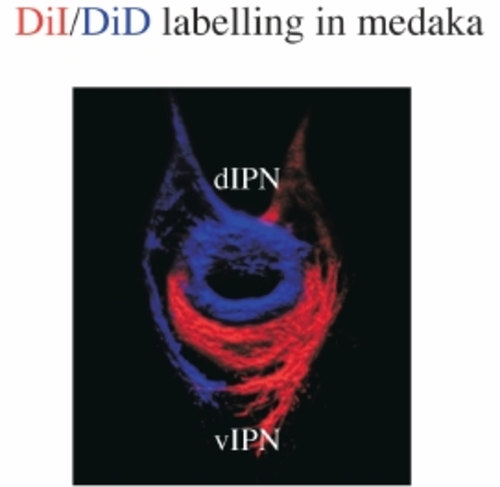
Left and right habenular axon terminals are segregated along the DV axis of the target IPN nucleus Dorsal view of the interpeduncular nucleus (IPN) in a 7 days old medaka embryo. DiI/DiD labelling of axonal projections from the habenulae shows the dorso-ventral segregation within the IPN similar to zebrafish (compare with e. g. Figure 4I). dIPN, dorsal and vIPN, ventral IPN. |
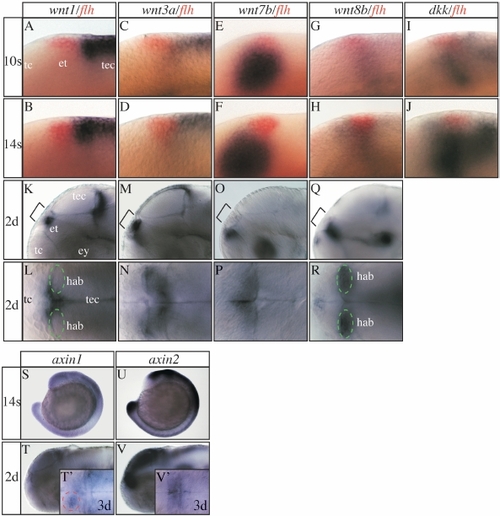
Expression of various Wnt pathway genes in and around the epithalamus. (A-K,M,O,Q,S-V) Lateral views and (L,N,P,R,T′,V′) dorsal views focused on the diencephalic epithalamus (et; except S,U). All developmental stages are indicated on the left of each horizontal row of panels and the marker genes used on the top of each vertical row. (A-J) floating head (flh) expression in the epithalamus (in red) has been used as a landmark. (I,J) dickkopf (dkk) is expressed in the epithalamic area at mid-somitogenesis stages. Its expression fades shortly later (data not shown). (S,T,T′) In zebrafish and Xenopus axin1 is initially expressed ubiquitously up to tailbud stages but becomes subsequently confined to the fore- and midbrain region (Hedgepeth et al., 1999; Van de Water et al., 2001). (T′) Similar to Xenopus we find increased axin1 expression in the habenula from three days of development onward, but more pronounced on the left side (red dotted circle). (U,V,V′) axin2 is expressed in the dorsal neural tube and CNS including the epithalamus also at later stages. For further details see supplementary results. ey, eye; hab, habenula (green circle); tc, telencephalon; tec, tectum. EXPRESSION / LABELING:
|

Mosaic overactivation of Wnt signalling can induce lft1 (A,B) Lateral views of the presumptive tail region of tailbud stage embryos, which have been injected with GFP:HS:lef-VP16 DNA (see also Bajoghli et al., 2007), heat shock treated at late gastrulation and 2 hrs later analysed for lft1 and GFP expression. Ectopic lft1 expression can be seen in the vicinity of GFP expressing cells. |