
- Title
-
Control of receptor internalization, signaling level, and precise arrival at the target in guided cell migration
- Authors
- Minina, S., Reichman-Fried, M., and Raz, E.
- Source
- Full text @ Curr. Biol.
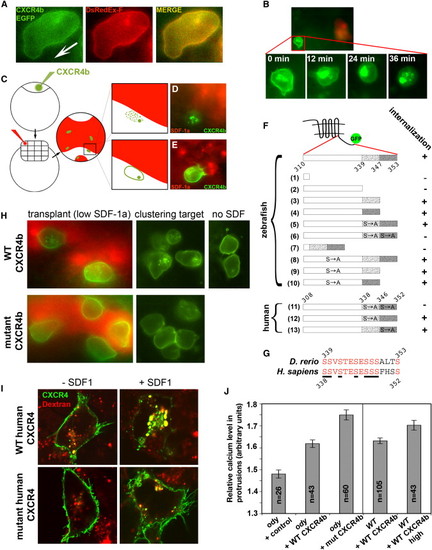
Identification and Functional Analysis of Domains and Amino Acids Required for Internalization of CXCR4b In Vivo (A) CXCR4b-EGFP (green) is evenly distributed on the plasma membrane in comparison to the membrane marker farnesylated DsRed-Express (DsRedEx-F, red). The arrow indicates the direction of cell migration. (B) In vivo internalization of CXCR4b in response to SDF-1a. CXCR4b-EGFP (green) is initially observed on the plasma membrane (0 min) and internalizes after transplantation of SDF-1a expressing cells in close proximity (12-36 min, SDF-1a expressing cells labeled in red). The cells that are exposed to very high SDF-1a levels (300 pg of injected RNA) do not migrate toward the chemoattractant source, presumably because of their inability to detect the gradient under these conditions. (C) Assaying receptor internalization by expression of SDF-1a in the endoderm. To assess the internalization potential of different mutant CXCR4b molecules (presented in [F]), we exposed PGCs expressing the different versions of CXCR4b fused to EGFP (green) to high levels of SDF-1a produced by endodermal cells (labeled in red, see Supplemental Experimental Procedures). (D) Wild-type CXCR4b-EGFP (green) internalizes when found in proximity to the SDF-1a source (red). (E) In the receptor, specific mutations that inhibit internalization of the CXCR4b-EGFP fusion protein (green) result in persistence of the signal on the membrane despite the exposure to SDF-1a-expressing cells (red). (F) Mutations in the C-terminal domain of CXCR4 and their effect on internalization. The C terminus of CXCR4 was mutated by introduction of deletions (constructs 1–4 and 7), by substitution of serines for alanines (constructs 5, 6, 8, and 11–13), or by both (constructs 9 and 10). "S→A" indicates that all serines in the region where this mark is positioned were replaced by alanine. The effect of these mutations on receptor internalization was assayed as described in (C). Internalization appearing as shown in (D) is marked "+", and lack of internalization as shown in (E) is marked "-." The internalization potential of the human CXCR4 mutants (constructs 11, 12, and 13 as well as the wild-type form) was assayed as shown in (I). (G) High conservation in the C terminus of CXCR4b between zebrafish and human (identical residues labeled in red). Serines that were mutated into alanine residues (E and F) are underlined. (H) Mutating serine residues at the C terminus of CXCR4b prevent the receptor internalization at physiological levels of SDF-1a. The wild-type CXCR4b is observed on plasma membrane and intracellular vesicles (upper panels), whereas the mutant receptor is localized exclusively to plasma membrane (lower panels). PGCs have arrived to a group of cells engineered to produce physiological levels of SDF-1a (red) (left panels, see Supplemental Experimental Procedures) or to the normal clustering position in response to endogenous SDF-1a (middle panels). In the absence of SDF-1, wild-type CXCR4b is not detected in the interior of the cells (right panel). (I) The alanine-exchanged mutant of human CXCR4 (construct 11 in [F]) demonstrates defective internalization. The wild-type form of human CXCR4 expressed in HEK-293 cells internalizes efficiently upon exposure to recombinant SDF-1 and translocates into vesicles that contained red fluorescent dextran that was added to the medium along with SDF-1 (signal colocalization appears yellow). In contrast, a mutated version of the human CXCR4 where seven serines were exchanged with alanine residues (mutant 11) fails to undergo internalization upon application of SDF-1. (J) Relative calcium level in protrusions of PGCs expressing different amounts or types of CXCR4b. PGCs in embryos lacking functional CXCR4b (ody mutants) expressing the "noninternalizable" mutant (mut) form of CXCR4b (construct 6 in [F], left part of the panel) and wild-type cells expressing high amounts of wild-type CXCR4b (right part of the panel) show significantly higher calcium level in protrusions in comparison to that in ody PGCs expressing the wild-type form of the receptor and wild-type cells expressing low amounts of wild-type receptor, correspondingly. The error bars represent the SEM, and “n” is the number of protrusions analyzed. The first three measurements (the left part of the panel) were compared with the Tukey HSD test. The different treatments of wild-type embryos (the right part of the panel) were compared with the t test. A value of p < 0.005 for both comparisons. |

Control of CXCR4b Internalization and Signaling Level Is Required for Precise Arrival of PGCs at the Region where the Gonad Develops (A–C) The wild-type and mutant (mut) form of CXCR4b differ in the ability to complement the ody mutation. GFP labeled PGCs in 24 hr ody embryos (A) are scattered throughout the embryo. Expression of wild-type CXCR4b in ody PGCs allows the cells to arrive at their target by the end of the first day of development (B), whereas the mutated internalization-defective receptor (mut CXCR4b, construct 6 in Figure 1F) is less effective (C). Insets in (B) and (C) are enlarged images of the area where the gonad develops in the corresponding embryos. Cells expressing the mutant CXCR4b often form a loose cluster. (D) The percentage of correctly migrating PGCs (cells that have arrived at the region where the gonad develops) in ody embryos and in ody embryos expressing the wild-type or the mutant form (mut CXCR4b, construct 6 in Figure 1F) of CXCR4b. The error bars represent the SEM, and "n" is the number of embryos examined. (E) Whole-mount in situ hybridization of an embryo whose PGCs (nanos-1 in blue) express a mutant form of CXCR4b. PGCs arrive at various sites of sdf-1a expression (labeled in red), other than the site of the gonad. The inset shows sdf-1a expressed along the lateral line that attracts PGCs located away from their correct target (for more examples, see FigureS1). (F) Increased signaling by CXCR4b disrupts normal PGC migration. Increasing the amount of wild-type CXCR4b (green) or mutant CXCR4b (red) RNA in wild-type PGCs results in an increase in the percentage of ectopic PGCs as assessed at the end of the first day of development. vasa-DsRed-3′ UTRnos1 was used as control RNA. Error bars represent SEM. A total of 20–40 embryos were analyzed for each point. |
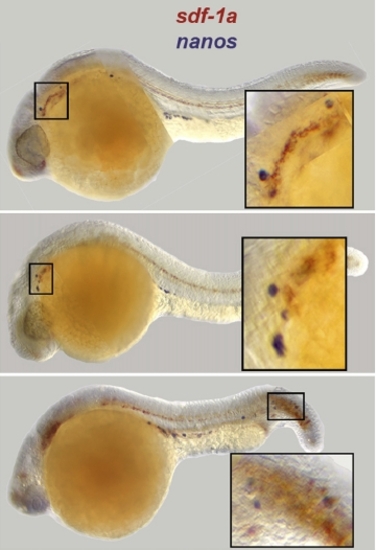
Examples of Faulty Arrival of PGCs to the Sites of sdf-1a Expression. PGCs are labeled by nanos-1 in blue, whereas sdf-1a RNA is labeled in red. The insets show sdf-1a expression at the positions where ectopic PGCs are found. |