
- Title
-
p53 activation by knockdown technologies
- Authors
- Robu, M.E., Larson, J.D., Nasevicius, A., Beiraghi, S., Brenner, C., Farber, S.A., and Ekker, S.C.
- Source
- Full text @ PLoS Genet.

p53 MO Attenuates Cell Death Induced by MOs and GripNAs (A–G and I–N) Brightfield images of 28 hpf embryos injected with demonstrative MOs and gripNAs. The arrows (C, E, I, and M) indicate neural death that is significantly attenuated to normal head size and morphology by co-knockdown of p53 (D, F, J, and N). Interestingly, Wnt5 MO2 shows no significant neural death (G) even at 6 ng, a higher dose than Wnt5 MO1 (E) (3 ng), but can elicit a highly penetrant Wnt5 phenotype even at 1.5 ng (unpublished data). (H) Effect of p53 MO on Wnt5 splicing. We carried out RT-PCR using primers spanning the exon 5–exon 6 junction targeted by Wnt5 MO1. Proper splicing was completely inhibited by Wnt5 MO1. p53 co-knockdown did not affect the efficiency of Wnt5 MO1 inhibition. Embryos injected with Wnt5 MO2, which targets the previous junction (exon 4–exon 5), still exhibited some properly spliced transcript at the exon 5–exon 6 junction. β-actin was used as a loading control. |
p53 MO Attenuates Apoptosis Induced by MOs and GripNAs, as Detected by TUNEL Assay (A–M) Fluorescent images of 30 hpf embryos injected with indicated MOs and subjected to TUNEL assay to detect apoptosis. A strong fluorescent signal for Smo MO (C), Wnt5 MO1 (E), and Wnt5 GripNA1 (H), similar to Mdm2 MO (L), indicates increased apoptosis. The fluorescent signal is strongly diminished by co-knockdown of p53 (D, F, I, and M), similar to the uninjected control (A), Wnt5 MO2 (G), or Wnt5 mutant (J). Wnt5 mutant is not affected by p53 knockdown (K). PHENOTYPE:
|
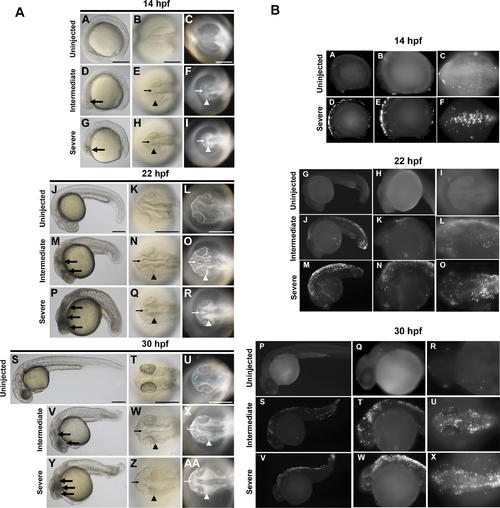
Temporal and Spatial Characterization of Representative MO-Induced Neural Cell Death during Early Embryogenesis (A) Brightfield and darkfield images of Wnt5 MO1-injected embryos. 14 hpf (A–I), 22 hpf (J–R), and 30 hpf (S–AA). Uninjected embryos (A–C, J–L, and S–U), intermediate cell death phenotype (D–F, M–O, and V–X), and severe cell death phenotype (G–I, P–R, and Y–AA). Lateral views (A, D, G, J, M, P, S, V, and Y), all others dorsal head views. Intermediate cell death is observed at 14 hpf as highly localized opaque cells in the head (large arrow in D), which are arranged near the lateral (arrowhead in E and F) and midline (small arrow in E and F) areas of the developing brain. This pattern progresses through 22 hpf and 30 hpf (M–O and V–X, respectively), including a concentration of opaque cells surrounding the emerging folds of the brain midline (small arrows N–O and W–X) and the eye (arrowheads N–O and W–X). Severe cell death is observed as highly dense areas of opaque cells throughout the developing head. (B) TUNEL assay. Zebrafish embryos were injected with Wnt5 MO1 and analyzed by TUNEL assay at 14 hpf (A–F), 22 hpf (G–O), and 30 hpf (P–X) stages. Uninjected embryos: A–C, G–I, and P–R. At the later time points two classes of phenotypes were observed: an intermediate (J–L and S-U) and a severely affected class of embryos (M–O and V–X). These were characterized by intense fluorescent apoptotic foci in the head and body, with increasing intensity corresponding to increased severity (higher MO dose). Please see Figure S1 for a higher resolution version of this figure. PHENOTYPE:
|

Representative Cell Death Phenotypes Detected at 26 hpf. Brightfield (A, B, D, E, G, H, J, and K) and darkfield images (C, F, I, and L) of 26 hpf zebrafish embryos injected with Wnt5 MO1. (M–X) TUNEL assay. Lateral views (A, D, G, J, M, N, P, Q, S, T, V, and W), with inserts showing a higher magnification of the head region (A, D, G, and J). Dorsal view of the head (B, C, E, F, H, I, K, L, O, R, U, and X). The two classes of phenotypes described in Figure 3 are observed at this time point, too (intermediate, G–I and P–R; severe, J–L and S–T; uninjected embryos, A–C and M–O). At 26 hpf, however, a milder cell death phenotype was also observed (D–F). This class of embryos exhibited an anterior-ventral concavity and a depressed hindbrain (indicated by the arrows), without tissue with obvious characteristic cell-death patterns featured by embryos with intermediate and severe phenotypes (compare [F] to [I] and [L]). However, even these mildly affected embryos showed clear apoptosis indicated by the TUNEL assay (P–R). PHENOTYPE:
|

p53 MO Does Not Affect Specific Cell Death or Phenotypes Not Associated with Apoptosis (A–B) Brightfield image of chordin morphant (3ng MO) injected (A) or not (B) with p53 MO (2 ng) (1 dpf). (C–D) p53 MO does not affect the localized tail cell death, as also shown by the TUNEL assay (1 dpf). (E–F) Brightfield images of 2 dpf uninjected embryo: lateral (E) and dorsal view (F). (G–H) p53 MO (4 ng) does not affect (H) the lack of dorsal melanophores induced by nacre MO (9 ng) (G). (I–J) no tail (3 ng) phenotype (I) is not affected by coinjection of 4 ng of p53 MO (J). (K–L) UROD MO (9 ng) induces an autofluorescence of red blood cells (K). This phenotype is not affected by p53 MO coinjection (4 ng) (L) (1 dpf). |
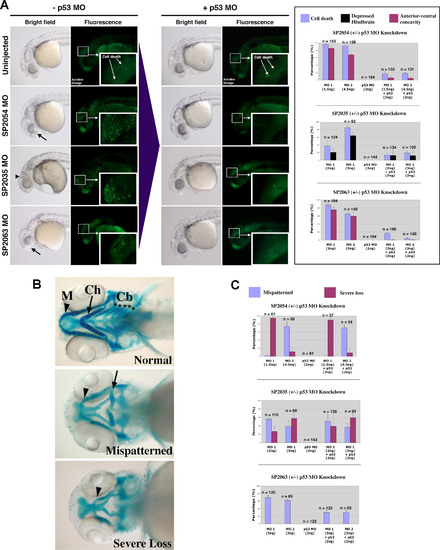
p53 MO Attenuates Cell Death Induced by MOs against Novel Target Genes with Divergent Effects on Craniofacial Phenotypes (A) Brightfield and fluorescent images of 1 dpf embryos injected with MOs targeted against three novel proteins: SP2054, SP2063 (two different MOs for each target: MO1 and MO2), and SP2035. Brightfield images depict observed anterior morphological defects: anterior-ventral concavity (black arrows) and depressed hindbrain (black arrowhead). Fluorescent images indicate areas of apoptosis visualized by live embryo acridine orange staining. Insets show a magnification of apoptotic foci in the head region. Upon p53 coinjection (+p53 MO), there is a significant attenuation of these phenotypes. These results are quantitated for each target in the right graph panel. (B) Brightfield images of 4.5 dpf embryos stained with Alcian Blue to visualize representative craniofacial phenotypes. Arrowheads indicate Meckel′s cartilage (M), arrows indicate ceratohyal arch (Ch). Stars indicate the five branchial arches (Cb). Upon MO targeting of the three novel genes, two types of craniofacial phenotypes were observed: mispatterning of the Meckel′s cartilage and ceratohyal (mispatterned phenotype), and loss of all branchial arches, ceratohyal and severe hypoplasia of the Meckel′s cartilage (severe loss phenotype). (C) Quantitation of the p53 MO effect on craniofacial phenotypes induced by MO targeting of three novel genes. Targeting of SP2054 with MO1 induced a high level of severe loss phenotype, while SP2054 MO2 showed mainly a mispatterned phenotype. None of these craniofacial phenotypes were affected by p53 MO. SP2035 knockdown induced both types of craniofacial abnormalities and the proportion of these was not affected by p53 co-knockdown. SP2063 MOs MO1 and MO2 induced a craniofacial mispatterning phenotype that was partially rescued by p53 MO, suggesting that this craniofacial phenotype is a secondary effect of off-target neural death. |
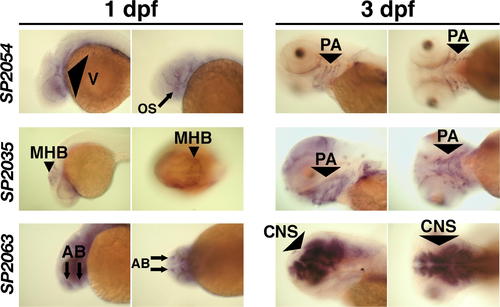
Expression Patterns of SP2035, SP2054, and SP2063. In situ hybridization for SP2054, SP2035, and SP2063 showed that all three transcripts were localized in anterior structures prior to chondrogenesis (1 dpf). Later in development, SP2054 and SP2035 transcripts became localized in pharyngeal arch structures during cartilage formation (2 dpf, see Figure S2; and 3 dpf), while SP2063 mRNA was expressed in brain structures.Please see Figure S2 for a higher resolution version that also includes a 2 dpf time point. AB, anterior brain; CNS, central nervous system; MHB, midbrain/hindbrain boundary; OS, optic stalk; PA, pharyngeal arch; V, vasculature. EXPRESSION / LABELING:
|

Quantitative RT-PCR of p21/WAF/CIP in Various Morphants. p21 RNA levels were significantly increased in MO-injected embryos that showed neural death (Smo MO, Wnt5 MO1, and Mdm2 MO) as compared to the uninjected control (UI). Interestingly, p21 levels were not significantly altered by Wnt5 MO2 (which does not induce neural death). Very importantly, p21 levels were significantly reduced in the respective MO-injected embryos upon p53 co-knockdown (Mdm2 MO p < 0.01, Wnt5 MO2 p < 0.01, Smo MO p < 0.002; t-test p values for unpaired sets), strongly suggesting that p21 is transcriptionally upregulated by p53 in the morphants with neural death. Error bars indicate standard deviation. EXPRESSION / LABELING:
|

p53 Isoforms Expression in Various MO-Injected Embryos (A) Schematic of p53 and Δ113 p53 transcripts. The p53 gene contains 11 exons (indicated by numbered rectangles), with the two promoters P1 and P2 indicated by the arrows. Transcription initiation at promoter P1 in exon 1 generates the full-length p53 transcript. Δ113 p53 transcript is initiated at an internal promoter in intron 4, P2, and contains the 3′ end of intron 4 (indicated by the yellow rectangle), and likely uses the Met at position 113 as translational start (red bar) [22]. Translation start sites for the two transcripts are indicated by the red bars (in exon 2 for P1; putative translation start in exon 5 for P2, corresponding to Met 113). Translational MO binding sites for the two isoforms are indicated by orange stars. The MO for full-length p53 most likely does not affect the Δ113 p53 transcript, as its binding site is 386 nt upstream of the translational start for the Δ113 p53 transcript. The fragments amplified for the RT-PCR experiments are indicated by the blue bars and are specific to each isoform. The riboprobe fragment for in situ hybridization (indicated by the green bars) and the microarray probe binding site (indicated by the purple bars) are common to both isoforms. (B) RT-PCR for full-length p53 and Δ113 p53. Final products of 30 cycles of RT-PCR for Δ113 p53 were analyzed by gel electrophoresis on a 1% agarose gel, stained with ethidium bromide. β-actin was used as loading control. There is no significant upregulation of full-length p53 expression levels in various morphants. Note the lack of expression of Δ113 p53 in uninjected embryos or morphants with no neural death. Embryos injected with MOs that cause neural death show a significant increase of Δ113 p53 isoform expression. (C) Transcripts induced by fhit knockdown in microarray assays. Fold increases in mRNA accumulation and t-test p values were calculated from the three control (phenol red-injected) intensities and the five experimental intensities determined in eight independent hybridizations using printed 16,399 element 65mer microarrays. The first three experimental samples were embryos injected with the gripNA targeting fhit while the fourth and fifth experimental samples were Fhit morphants. NCBI unigene identifiers are for the D. rerio genes. Gene symbols correspond to human orthologs. The three transcripts common to the top eight induced transcripts in fhit and def [22] datasets are indicated. (D) p53 in situ hybridization. Expression of p53 transcripts is increased in the anterior part of the embryo (indicated by the arrow) upon injection of Wnt5 MO1 (that causes neural death), but not in the morphant with no neural death (Wnt5 MO2). EXPRESSION / LABELING:
|