
- Title
-
The characterization of zebrafish antimorphic mib alleles reveals that Mib and Mind bomb-2 (Mib2) function redundantly
- Authors
- Zhang, C., Li, Q., Lim, C.H., Qiu, X., and Jiang, Y.J.
- Source
- Full text @ Dev. Biol.

Phenotypic severity of different mib mutants. (A) mib somite phenotype at 22ss. Somite 10 and last discernible somite are marked. See the text and Table 1 for the phenotypic grouping and mutant description of different genotypes. (B) 3dpf tail and pigment phenotypes. Arrowheads mark the hemorrhage sites. (C) Dorsal view of deltaC hindbrain reticulospinal neurons at 10ss. (D) Lateral view of midline phenotypes demonstrated by col2a1 expression at 30hpf. Obvious gaps (marked by green arrows) in mibm132 and mibta52b mutants and elongated cells in mibtfi91 mutants can be seen in hypochord, indicating a reduction in cell number (red arrowheads mark the boundaries of hypochord cells). mib floor-plate cells are less tightly packed and appear to be round and larger (insert in panel d) than in wt embryos and they are often dorsally displaced in mibta52b mutants. (E) WISH analysis of mib mutants by her4 at 22hpf, (a–e) head region, dorsal view; (a′–e′) trunk region; and (a″–e″) tail region around cloaca, both lateral view. All are head to the left, except head to the top in panel A. EXPRESSION / LABELING:
PHENOTYPE:
|

The mibta52b and mibm132 antimorphic phenotypes are caused by Mibta52b and Mibm132 proteins, respectively. (A–C) Control (or mib-m2-injected) wt (or mibta52b) embryos probed with (A) deltaC at 10ss, dorsal view; (B) huC at 10ss, dorsal view, and (C) her4 at 22hpf, (a–d) head region, dorsal view and (a2–d2) trunk region, lateral view. (D–F) 3dpf tail pigment phenotype in panel D (a) control mibta52b or (b, c) mib-m2-injected mibta52b embryos, (E) mib-m1-injected mibta52b embryos and (F) (a) control mibm132 or (b) mib-m2-injected mibm132 embryos. All are lateral views. (G) her4 expression at 22hpf in control or mib-m2-injected mibm132 embryos, (a–b) head region, dorsal view and (a′–b′) trunk region, lateral view. All are head to the left. EXPRESSION / LABELING:
PHENOTYPE:
|
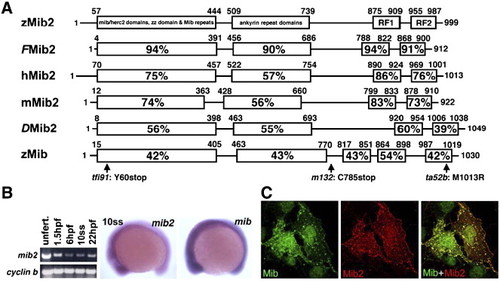
Gene comparison, expression and colocalization of Mib2 and Mib. (A) Comparison of Mib2 proteins. The percentage of amino acid identity of different domains of Mib2 from different species (z: zebrafish; F: Fugu; h: human; m: mouse; D: Drosophila) and zMib compared to those of zMib2 is given. (B) RT-PCR analysis of mib2 expression. cyclin b mRNA is amplified as a control. mib2, like mib, is ubiquitously expressed. (C) Mib and Mib2 are colocalized in COS7 cells. EXPRESSION / LABELING:
|

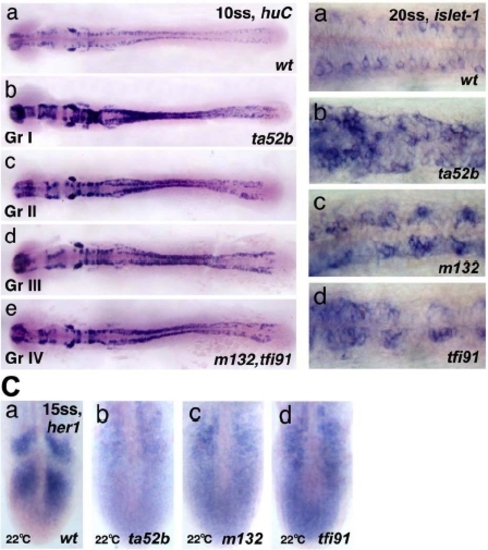
mib2 knock-down in mibtfi91 embryos phenocopies mibta52b and mibm132. (A) her4 expression in (a–a″) control mibta52b, (b–b″) mib mRNA-injected mibta52b, and (c–c″) mib2 mRNA-injected mibta52b embryos at 22hpf; (a–c) head region, dorsal view; (a′–c′) trunk region, and (a″–c″) tail region around cloaca, both lateral view. (B) 3dpf tail pigmentation of (a) control mibta52b and (b) mib mRNA-injected mibta52b embryos, lateral view. (C–E) Phenotypic analysis in control or mib2-m3-injected mibtfi91 embryos. (C) islet-1 expression at 20ss, dorsal view; (D) her4 expression at 22hpf; (a–d) head region, dorsal view; (a′–d′) trunk region, lateral view and (E) 3dpf tail pigmentation, lateral view. EXPRESSION / LABELING:
PHENOTYPE:
|

Mibm132 and Mibta52b behave dominant-negatively. (A) Somite phenotype at 22ss of (a) control wt embryos, (b) mib(m132) mRNA-injected, and (c) mib(ta52b) mRNA-injected wt embryos; (d) mib(m132) mRNA-injected and (e) mib(ta52b) mRNA-injected embryos from incrosses of mibtfi91 carriers. (B) 3dpf tail and pigmentation phenotypes of (a) control wt embryos; (b) control mibtfi91 embryos; (c) type I and (c2) type II mib(m132)-injected wt embryos; (d) type I and (d′) type II mib(ta52b)-injected wt embryos; (e) type I, (e′) type II, and (e″) type III mib(m132)-injected embryos from incrosses of mibtfi91 carriers; (f) type I, (f′) type II, and (f″) type III mib(ta52b)-injected embryos from incrosses of mibtfi91 carriers. Note that type I: normal somite, curly-up tail and normal tail pigment; type II: abnormal somite, curly-up tail and normal tail pigment; and type III: abnormal somite, curly-up white tail. The numbers in the right upper corner indicate the frequency of each type (Table 3). (C) huC expression at 10ss in dorsal view of (a) control wt embryos, (b) control mibtfi91 embryos, and (c) mib(m132)-injected wt embryos; (d) mib(m132)-injected and (e) mib(ta52b)-injected embryos from incrosses of mibtfi91 carriers. (D) her4 expression at 22hpf of (a–a″) control wt embryos and (b–b″) control mibtfi91 embryos; (c–c″) mib(m132)-injected and (d–d3) mib(ta52b)-injected embryos from incrosses of mibtfi91 carriers; (a–d) head region, dorsal view; (a′–d′) trunk region and (a″–d″) tail region around cloaca, both lateral view. |

mib expression is negatively regulated by Su(H)-dependent Notch activation. (A) mib expression in (a) wt and (b) mibta52b embryos at 22hpf, lateral view. The inserts show the mib expression in (a′–b′) the brain region, dorsal view and (a″–b″) a transverse section across posterior trunk. (B) her4 expression in (a–a′) control wt and (b–b′) su(h)-m7-injected embryos at 22hpf; (a–b) head region, dorsal view; (a′–b′) trunk region, lateral view. mib expression in (c) control wt and (d) su(h)-m7-injected embryos at 22hpf, lateral view. The inserts show the mib expression in the (c′–d′) head region, dorsal view and (c″–d″) a transverse section across posterior trunk. (C) her4 expression in (a–a′) control wt, (b–b′) DAPT-treated and (c–c′) X-Su(H)/Ank mRNA-injected embryos at 22hpf; (a–c) head region, dorsal view; (a′–c′) trunk region, lateral view. mib expression in (d–d′) control wt, (e–e′) DAPT-treated, and (f) X-Su(H)/Ank mRNA-injected embryos at 22hpf; (d–f) mid- and hindbrain region, dorsal view; (d′–e′) trunk and tail region, lateral view. (D) Coexpression of mib with ngn1 or dbx1a in hindbrain differentiating neurons at 42hpf. (a–c) and (e) are dorsal view; (d) and (f–h) are lateral view. Note that ngn1 and dbx1a are coexpressed with mib in different subpopulations of neurons. EXPRESSION / LABELING:
|

WISH analysis of mib mutants. (A) Dorsal view of mib mutants by huC WISH analysis at 10 somite stage. (B) islet-1 trunk motoneurons at 20 somite stage. (C) her1 expression in mib mutants at 15 somite stage at 22°C. EXPRESSION / LABELING:
|
mib expression is up-regulated in Group I, II and III mib mutants. mib expression of (a-a″) wild-type, (b-b″) Group I mib embryo, (c-c″) Group II and (d-d″) Group III mib embryos mib embryos at 22hpf stage; (a-d) whole embryo, (a′-d′) anterior part of embryo and (a"-d") posterior part of embryo. Note that the mib expression in the Gr IV mib embryos is basically similar to that of wild-type. EXPRESSION / LABELING:
|

Phenotypic comparison among different mib alleles and transheterozygotes. PHENOTYPE:
|

Summary of the morpholino (MO) injection data (all MOs were co-injected with 0.06% dextran) PHENOTYPE:
|
Reprinted from Developmental Biology, 305(1), Zhang, C., Li, Q., Lim, C.H., Qiu, X., and Jiang, Y.J., The characterization of zebrafish antimorphic mib alleles reveals that Mib and Mind bomb-2 (Mib2) function redundantly, 14-27, Copyright (2007) with permission from Elsevier. Full text @ Dev. Biol.