
- Title
-
Patterning the zebrafish diencephalon by the conserved zinc-finger protein Fezl
- Authors
- Jeong, J.Y., Einhorn, Z., Mathur, P., Chen, L., Lee, S., Kawakami, K., and Guo, S.
- Source
- Full text @ Development
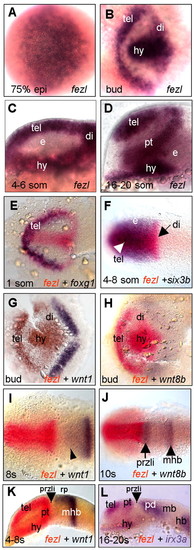
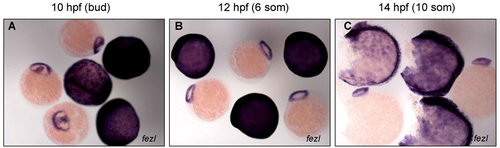
fezl expression in the developing forebrain demarcates the prospective telencephalon, hypothalamus and prethalamus. (A-L) Analysis of gene expression. Arrow in F indicates the prospective diencephalon; arrowhead in F indicates the telencephalon; arrowhead in I indicates wnt1 expression; arrow in J and arrowhead in K,L indicate the presumptive ZLI; arrowhead in J indicates the MHB. All are dorsal views except C,D,K,L, which are lateral views. Stages and marker identities are indicated in each panel. di, prospective diencephalon; e, eye region; hy, hypothalamus; hb, hindbrain; mhb, midhindbrain boundary; pd, posterior diencephalon; przli, presumptive ZLI; pt, prethalamus; tel, telencephalon; epi, epiboly; som, somite. EXPRESSION / LABELING:
|
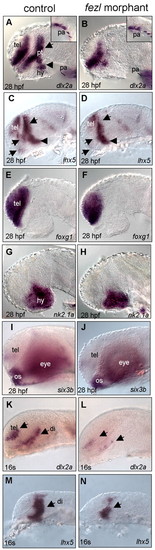
Reduced fezl activity results in a deficit of the prethalamus. (A,B) Severe deficit of dlx2a in the prethalamus of a 28-hpf fezl morphant. Insets in A,B show unaffected dlx2a expression in the pharyngeal arch (pa) area. Arrow in A indicates dlx2a-expressing prethalamic cells; arrowhead in A indicates dlx2a-expressing hypothalamic cells. (C,D) Reduction of lhx5 in the prethalamic region of the fezl morphant. Arrows in C,D indicate lhx5-expressing prethalamic cells; arrowhead in C,D indicates lhx5-expressing posterior tubercular cells. (E-J) Expression of foxg1 in the telencephalon (E-F), nk2.1a in the hypothalamus (G-H) and six3b in the eye and optic stalk (I-J) are largely normal in fezl morphants. (K-N) Reduction of dlx2a and lhx5 expressions in 16-somite (16s) fezl morphants. Arrows in K,L indicate the telencephalon and prospective diencephalon; arrow in M,N indicates the prospective diencephalon. All are lateral views with specific stages and marker identities indicted in each panel. di, prospective diencephalon; hy, hypothalamus; pt, prethalamus; tel, telencephalon; os, optic stalk. EXPRESSION / LABELING:
|
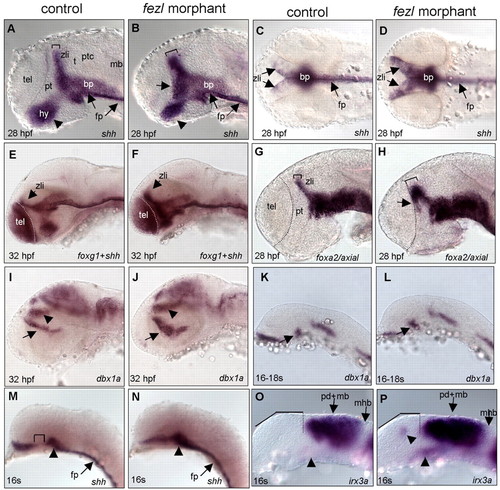
The fezl morphants exhibit anterior expansion of the ZLI. (A-D) Marked anterior expansion of shh-expressing ZLI (B,D) was observed in fezl morphants. Arrows in A,B indicate the floor plate; arrowhead in A,B indicates hypothalamus; square brackets indicate the ZLI. (E,F) Double labeling of foxg1 (a telencephalic marker) and shh, showing the expression of shh in the prethalamic area in the fezl morphant. (G,H) Anterior expansion of foxa2 expression in the fezl morphant. Arrow in H indicates the expansion of foxa2-expressing cells; square brackets indicate the ZLI. (I,J) Expanded expression of dbx1a near the ZLI (arrow) and in the thalamus (arrowhead) in the fezl morphant. (K-P) dbx1a, shh and irx3a expression in the 16-somite-stage (16s) control and fezl morphants. Arrows in I-L indicate lhx5-expressing cells in the posterior tubercular region, and in M-N indicate the floor plate; arrowhead in I,J indicates lhx5-expressing cells in the thalamus, and in M-P indicates expanding shh expression in the presumptive ZLI; square bracket in M indicates the ZLI; dotted line in O,P indicates the anterior boundary of irx3a expression in the posterior diencephalon and midbrain region. All are lateral views of embryonic brains, except C,D, which are dorsal views. t, thalamus; hy, hypothalamus; mb, midbrain; ptc, pretectum; tel, telencephalon; fp, floor plate; bp, basal plate. EXPRESSION / LABELING:
|
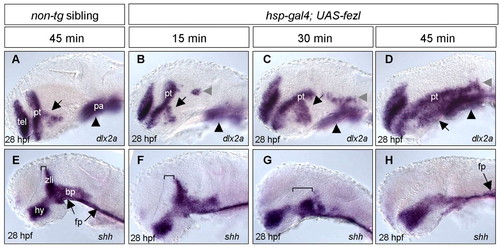
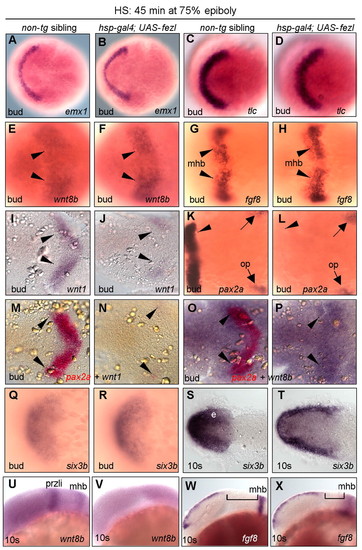
Overexpression of fezl results in an expansion of the prethalamus and the elimination of the ZLI in a dose-dependent fashion. The hsp-gal4 transgenic fish are crossed with uas-fezl transgenic fish and embryos are heat shocked at 37°C for 15-45 minutes at ~75% epiboly. Embryos are stained with indicated probes and analyzed at 28 hpf. Genotypes are identified by PCR with DNA from the tail. (A-D) The expression of dlx2a in the prethalamus is mostdramatically expanded. Its expression in the ventral telencephalon is mildly increased whereas its expression in the pharyngeal arches (pa) is not significantly altered. Arrow in A-D indicates dlx2a-expressing hypothalamic cells; black arrowheads in A-D indicate the pharyngeal arches; gray arrowhead in B-D indicates ectopic dlx2a-expressing cells in the midbrain. (E-H) The ZLI, as shown with shh expression, is moved caudally or completely eliminated depending on the duration of heat shock, but shh expression in the floor plate (fp) is unaffected. Square brackets indicate the ZLI. All are lateral views. hy, hypothalamus; pt, prethalamus; tel, telencephalon; fp, floor plate; bp, basal plate; pa, pharyngeal arches. EXPRESSION / LABELING:
|
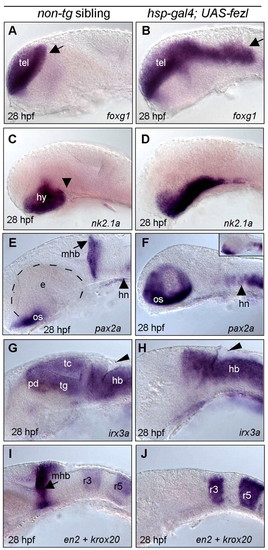
Overexpression of fezl expands the telencephalon and hypothalamus at the expense of other fore- and mid-brain regions. (A-D) Expansion of telencephalic foxg1 (B) and hypothalamic nk2.1a (D), as compared with wild type (A,C). Arrow in A,B indicates foxg1-expressing cells; arrowhead in C indicates posterior boundary of nk2.1a-expressing cells. (E,F) Expansion of the optic stalk (os), reduction of the eyes and loss of MHB in fezl-overexpressing embryos (F) compared with wild-type (E). Inset in F shows another embryo of the same genotype as that shown in F, with a less-dramatic expansion of optic stalk but missing pax2a-expressing midbrain cells. (G-J) Loss of caudal diencephalic and midbrain irx3a (H) and MHB eng2 (J) expression in fezl-overexpressing embryos. Arrowhead in G,H indicates the mid-hind-brain boundary. All are lateral views of embryonic brain regions labeled with various region-specific markers. Stages and marker identities are specified in each panel. hy, hypothalamus; mhb, mid-hind-brain boundary; tel, telencephalon; os, optic stalk; e, eye region; tc, tectum; hb, hindbrain; pd, posterior diencephalon; tg, tegmentum. EXPRESSION / LABELING:
|
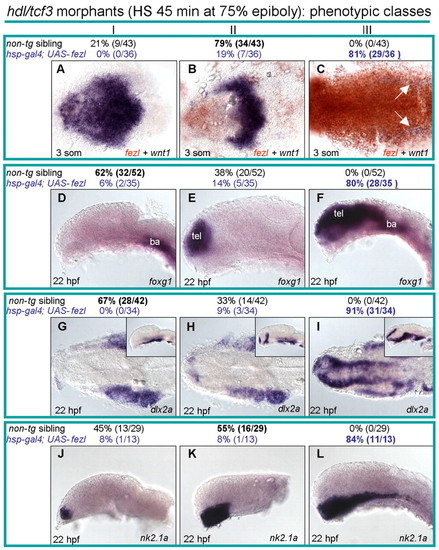
fezl overexpression is sufficient to repress wnt1 and to restore anterior forebrain gene expression in Headless and/or Tcf3-deficient embryos. (A-L) Analysis of gene expression. The hdl/tcf3 morpholino was injected into one- to eightcell-stage embryos derived from the hsp-gal4/+Xuas-fezl cross. These hdl/tcf3 morphants were subjected to heat shock at ~75% epiboly, analyzed for forebrain gene expression at ~28 hpf with various markers (as specified in each panel) and subsequently genotyped for the presence or absence of the transgenes. In general, three classes of phenotypes were observed for each marker, and their percentage distributions in the non-transgenic heat-shocked hdl/tcf3 morphants versus in the double transgenic heat-shocked hdl/tcf3 morphants are indicated above each panel. A-C,G-I are dorsal views and D-F,J-L are lateral views. Insets in G-I show lateral views of the same embryos. Arrow in C represents residual wnt1-expressing cells. tel, telencephalon; ba, branchial arches. EXPRESSION / LABELING:
|
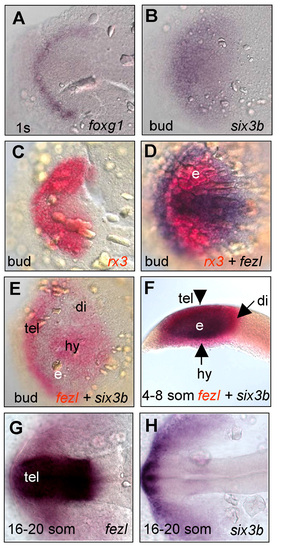
Role of fezl in forebrain patterning. The expression of foxg1 (A) and six3b (B). The expression of fezl (purple) is complementary to the eye field marker rx3 (red, C-D). (E-F) The expression of fezl (red) and six3b (purple). (G-H) The expression of fezl (G) and six3b (H). EXPRESSION / LABELING:
|
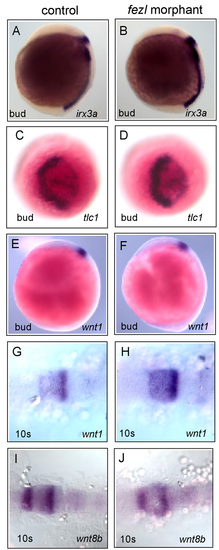
Phenotypes of early stage fezl morphants. (A-F) Bud stage showing largely normal expression of irx3a, tlc1 and wnt1. (G-J) Mid-somitogenesis stage showing largely normal expression of wnt1 and wnt8b. EXPRESSION / LABELING:
|
Forced expression of fezl by heat shock. The expression of fezl reached a maximum level approximately 2 hours after heat shock (A) and was maintained for another 2 hours (B). 6 hours later, ectopic fezl expression was still detectable in the double transgenic embryos (C). |