
- Title
-
Zebrafish pax5 regulates development of the utricular macula and vestibular function
- Authors
- Kwak, S.J., Vemaraju, S., Moorman, S.J., Zeddies, D., Popper, A.N., and Riley, B.B.
- Source
- Full text @ Dev. Dyn.

cDNA structure and expression of pax5. A: General structure of pax5 splice variants. Brackets indicate exon boundaries. Conserved functional domains, paired (PD), octapeptide (OP), homeo (HD), transactivation (TAD), and inhibitory (ID) are marked. Putative translation start sites (M) are indicated. Binding sites for translation-blocking (TB1 and 2) and splice-blocking (SB1, 2, and 3) morpholinos are shown. Newly identified 5′ (i) and 3′ (ii) sequences are shown in comparison with fugu pax5. Zebrafish and fugu sequences are 100% identical at the amino acid level. B-E: Expression of pax5 in the otic placode at 17 hours postfertilization (hpf; B), in the otic vesicle at 24 hpf (C) and in the utricular macula at 48 hpf (D,E). E: Enlarged view of boxed area in D. Hair cell (hc) supporting cell layers are marked. Arrow, weak expression in the saccule. (A) Dorsal, (B) dorsolateral, and (C,D) lateral views, with anterior to the left. Scale bar = 30 μm in A, 40 μm in B,C, 12.5 μm in D. EXPRESSION / LABELING:
|

A-C: Assessment of vestibular and auditory function. Development of balance (A), motor coordination (B), and swim bladder inflation (C) in wild-type (n = 173), pax5-morphant (n = 330), lia/lia (n = 110) and mnl/mnl (n = 238) embryos between 3 and 7 days postfertilization (dpf). Data show the means and standard errors of two independent experiments. D: Frequency range and sensitivity of hearing in wild-type larvae and pax5 morphants at 5 dpf. Only pax5 morphants with severe vestibular deficits were used in D. PHENOTYPE:
|
cDNA structure and expression of pax5. A: General structure of pax5 splice variants. Brackets indicate exon boundaries. Conserved functional domains, paired (PD), octapeptide (OP), homeo (HD), transactivation (TAD), and inhibitory (ID) are marked. Putative translation start sites (M) are indicated. Binding sites for translation-blocking (TB1 and 2) and splice-blocking (SB1, 2, and 3) morpholinos are shown. Newly identified 5′ (i) and 3′ (ii) sequences are shown in comparison with fugu pax5. Zebrafish and fugu sequences are 100% identical at the amino acid level. B-E: Expression of pax5 in the otic placode at 17 hours postfertilization (hpf; B), in the otic vesicle at 24 hpf (C) and in the utricular macula at 48 hpf (D,E). E: Enlarged view of boxed area in D. Hair cell (hc) supporting cell layers are marked. Arrow, weak expression in the saccule. (A) Dorsal, (B) dorsolateral, and (C,D) lateral views, with anterior to the left. Scale bar = 30 μm in A, 40 μm in B,C, 12.5 μm in D. EXPRESSION / LABELING:
|
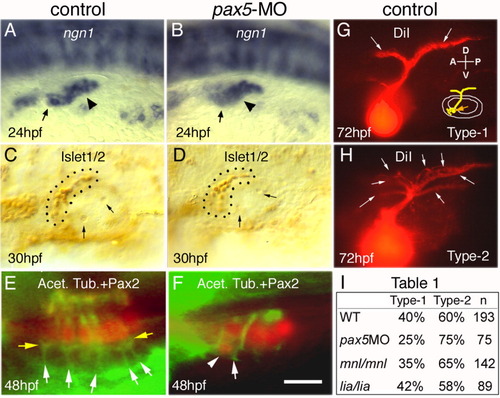
Development of the statoacoustic ganglion (SAG). A,B: Expression of ngn1 in the otic vesicle (arrowheads) and SAG (arrows) in a control embryo (A) and pax5-morphant (B) at 24 hours postfertilization (hpf). C,D: Anti-Islet-1/2 staining of SAG neuroblasts (outlined) at 30 hpf. An average of 16.5 ± 4.2 neuroblasts were detected in control embryos (C) compared with 15.7 ± 3.5 in pax5 morphants (D). Arrows mark otoliths. E,F: Utricular maculae of a 48 hpf control embryo (E) and pax5 morphant (F), showing acetylated tubulin (green) relative to Pax2 in hair cell nuclei (red). White arrows in E mark axonal process projecting to hair cells and broader regions of staining (yellow arrows) are observed at the basal regions of hair cells, possibly associated with synapses. Specimen in F shows a misplaced hair cell (arrowhead) associated with a single thick SAG process (arrow). G,H: Central projections of SAG neurons visualized by injecting DiI (1,1-dioctadecyl-3,3,3,3 -tetramethylin-docarbocyanine perchlorate) into the utricular macula at 72 hpf. Schematic in G shows the site of DiI injection (orange arrow) and SAG projections relative to the ear. Wild-type larvae show either two discrete axonal bundles in the hindbrain (G, type-1) or more diffuse projection patterns (H, type-2), including smaller secondary branches indicated by arrows. I: Table 1, percentage of larvae showing type-1 or type-2 projection patterns in control embryos, pax5 morphants, mnl/mnl mutants, and lia/lia mutants. A-K: Images show dorsolateral (A,B,E,F), dorsal (C,D), and lateral (G-K) views, with anterior to the left. Scale bar = 50 μm in A,B,E,F, 30 μm in C,D, 12.5 μm in G-K. |
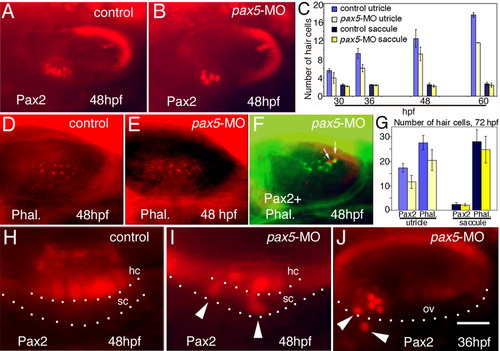
Assessment of hair cell development. A,B: Anti-Pax2 staining in the otic vesicle in a control embryo (A) and pax5 morphant (B) at 48 hours postfertilization (hpf). C: Number of Pax2+ hair cells at the indicated stages (means and standard errors of at least three experiments, with at least 15 specimens/time-point/experiment). P values for the comparison of control embryos vs. pax5 morphants are as follows: utricle, P = 0.042 (30 hpf), P = 0.009 (36 hpf), P = 0.0007 (48 hpf), P = 0.017 (60 hpf); and saccule, P = 0.136 (30 hpf), P = 0.138 (36 hpf), P = 0.05 (48 hpf), P = 0.28 (60 hpf). D,E: Rhodamine-phalloidin staining in the saccular macula of a control embryo (D) and pax5 morphant (E) at 48 hpf. In control embryos (n = 23), there were 21.5 ± 5.0 hair cells in the utricular macula and 17.8 ± 9.7 in the saccular macula. In pax5 morphants (n = 42), there were 16.8 ± 4.5 hair cells in the utricle and 14.8 ± 7.5 in the saccule. F: Saccular maculae stained with anti-acetylated tubulin (green) and anti-Pax2 (red) in a pax5 morphant at 48 hpf. Only two hair cells are Pax2-positive (arrows). G: Hair cell numbers detected by anti-Pax2 or phalloidin staining in pax5 morphants and uninjected controls at 72 hpf. Data bars are color-coded as in C. H,I: Enlarged view of the utricular macula stained with anti-Pax2 at 48 hpf in a control embryo (H) and pax5 morphant (I). Basal edges of hair cell (hc) and supporting cell (sc) layers are indicated. J: Otic vesicle of pax5 morphant stained with anti-Pax2 at 36 hpf. Arrowheads mark misplaced hair cells. The ventral limit of the otic vesicle (ov) is indicated. Images show dorsolateral (A,B,D-F,J) and lateral (H,I) views with anterior to the left. Scale bar = 40 μm in A,B,D-F, 12.5 μm in H,I, 25 μm in J. PHENOTYPE:
|

Analysis of cell death in pax5 morphants. A,B: Acridine orange (AO) staining in the otic vesicle of a control embryo (A) and in the utricle of a pax5 morphant (B) at 48 hours postfertilization (hpf). White arrows indicate AO-positive cells, black arrows show otoliths. C,D: Terminal deoxynucleotidyl transferase-mediated deoxyuridinetriphosphate nick end-labeling (TUNEL) staining in the utricle of a control embryo (C) and a pax5 morphant (D) at 48 hpf. E: The arrowhead shows a TUNEL-positive cell. E,F: A pax5-morphant stained with acridine orange at 48 hpf (E) and subsequently stained with anti-Pax2 (F). An AO-positive cell appears in the same position as a misplaced hair cell (white arrows). The utricular macula is outlined in A-F. G: Cumulative data (n = 30) representing the frequency and distribution of AO-labeled cells in the otic vesicle of a wild-type control embryo, a pax5 morphant, and a noi/noi mutant at 48 hpf. The positions of labeled cells (red spots) were projected onto schematic maps of the otic vesicle. Positions of the utricular macula (u), saccular macula (s), anterior crista (ac), lateral crista (lc), and posterior crista (pc) are indicated. All images show lateral views, with anterior to the left. Scale bar = 40 μm in A, 25 μm in B-D, 30 μm in E,F, 50 μm in G. PHENOTYPE:
|

Otic development in noi (pax2a) and lia (fgf3) mutants. A,E,F: Otic expression of pax5 in noi/noi (A) and lia/lia (E,F) mutants at 24 hours postfertilization (hpf). Arrowheads mark the pax5 expression domain. B: Statoacoustic ganglion (SAG) projections in a noi/noi mutant labeled by injecting DiI (1,1′, di-octadecyl-3,3,3′,3′,-tetramethylindo-carbocyanine perchlorate) into the utricular macula at 72 hpf. C,G: Acridine orange (AO) staining in noi/noi (C) and lia/lia (G) mutants at 48 hpf. D,H: terminal deoxynucleotidyl transferase-mediated deoxyuridinetriphosphate nick end-labeling (TUNEL) staining in noi/noi (D) and lia/lia (H) mutants at 48 hpf. White arrowheads indicate apoptotic cells in C and D, and black arrows mark otoliths. Utricular maculae are outlined in C, D, G, and H. I,J: Rhodamine-phalloidin labeling of the utricular macula (outlined) in wild-type (I) and noi/noi (J) embryos at 48 hpf. K,L: Anti-Pax2 staining of the otic vesicle in wild-type (K) and lia/lia (L) embryos at 30 hpf. I-L: White arrows indicate hair cell patches. A-L: Images show dorsolateral (A,B,E,F,I-L) and lateral (C,D,G,H) views, with anterior to the left. Scale bar = 30 μm in A,E,F,K,L, 50 μm in B, 25 μm in C,D,G,H,I,J. |