
- Title
-
Small molecule-induced ablation and subsequent regeneration of larval zebrafish melanocytes
- Authors
- Yang, C.T., and Johnson, S.L.
- Source
- Full text @ Development
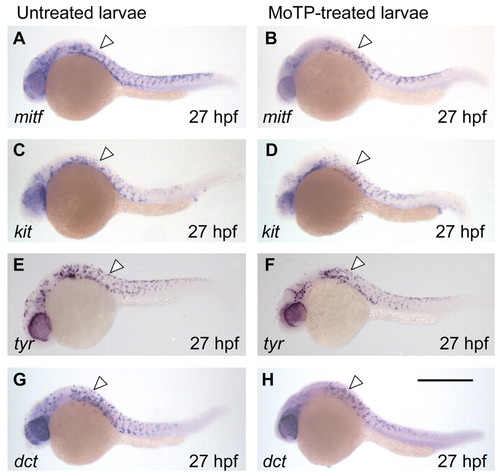
Melanocyte lineages develop to late stages in the presence of MoTP. (A-H) The development of melanocyte lineages in MoTP-treated (B,D,F,H) and untreated (A,C,E,G) larvae were examined by whole-mount RNA in situ hybridization with mitf (A,B), kit (C,D), tyr (E,F) and dct (G,H). For these experiments, embryos were incubated in MoTP solution from 14 to 27 hpf, then immediately fixed for in situ analysis. The developmental patterns and the numbers of cells (white arrowheads) for each of the markers are indistinguishable in the MoTP-treated larvae from those in untreated larvae. Untreated larvae were reared in PTU to completely block melanin synthesis, thereby allowing easier visualization of NBT/BCIP precipitates in melanocytes. Scale bar: 500 μm. EXPRESSION / LABELING:
|

The number of dct+ cells declines in the presence of MoTP. (A-H) The development of late-stage dct+ cells was further examined as the MoTP incubation continued. Larvae were reared in MoTP solution beginning at 14 hpf and fixed at selected developmental stages up until 68 hpf for in situ analysis. (A,C,E) The distribution and the number of dct+ cells in untreated larvae (reared in PTU solution) at 37, 42 and 61 hpf, respectively. Note that many dct+ cells in the untreated animals are differentiated melanocytes that remain unpigmented as a result of PTU treatment. (B,D,F) dct+ cells in the MoTP-treated larvae at 37, 42 and 61 hpf, respectively, revealing a gradual disappearance of dct+ cells during the MoTP incubation. The number of dct+ cells in the MoTP-treated larvae begins to decline from a maximum of ∼100 dct+ cells at 31 hpf to an average of 15 dct+ cells by 60 hpf (red line in H). These dct+ cells have a stereotyped spacing pattern in the dorsum (white arrowheads in G). By contrast, the number of dct+ cells steadily increases to more than 300 in the untreated larvae (blue line in H). Scale bar: in B, 500 μm for A-D; in F, 400 μm for E,F; in G, 400 μm. |

The melanocytotoxicity of MoTP is mediated by tyrosinase activity. (A) The chemical structure of (2-morpholinobutyl)-4-thiophenol (MoTP). (B) Dendritic (healthy) melanocytes (black arrowheads) in an untreated larva at 3 dpf. (C) When larvae were incubated in MoTP solution from 14 to 72 hpf, no neural crest-derived melanocytes were observed, but RPE is lightly pigmented (black arrow). (D,E) When 48 hpf larvae with pigmented melanocytes were shifted to MoTP, within 24 hours, larval melanocytes had become punctate (white arrowheads in D) and began to extrude from the epidermis (white arrow in E), a hallmark of melanocyte cell death. (F) The melanocytotoxicity of MoTP was blocked by PTU, as indicated by the dendritic appearance of lightly pigmented melanocytes (black arrowheads in F) following co-incubation of MoTP and PTU from 48 to 72 hpf. (G) The chemical structure of 4-hydroxyanisole (4-HA). (H) When larvae were incubated with 4-HA from 14 to 72 hpf, the same punctate melanocyte pattern of cell death appeared (white arrowheads). (I) Illustration of the mechanism of 4-HA melanocytotoxicity (see Riley, 1985). Note that tyrosinase converts the prodrug 4-HA to a cytotoxic o-quinone. Because copper is an essential cofactor for tyrosinase, its activity is blocked by co-incubation with PTU, a copper chelator. Timelines (gray) below the panels indicate the period of drug treatments (red) and analysis time (vertical line above timelines). Scale bars: in H, 500 μm for B-D,F,H; in E, 50 μm. |
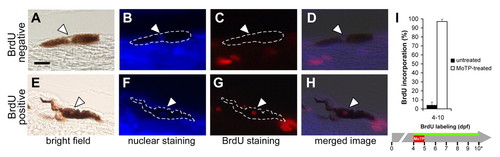
Larval melanocyte regeneration following MoTP treatment is achieved by cell division. (A-H) Cell division events in melanocyte lineages during larval melanocyte regeneration were tracked by BrdU incorporation experiments. Larvae were continuously incubated in BrdU (5 mM) during and after MoTP treatment, then fixed, paraffin embedded and 5 μm sagittal sections processed for BrdU immunohistochemistry after melanocyte regeneration was mostly completed at 10 dpf (5 days post-MoTP treatment). BrdU incorporation states of pigmented melanocytes were assessed by first identifying melanocyte nuclei (thinning in melanin, white arrowheads in A and E) accompanied by bisbenzimide staining (white arrowheads in B and F). These were then examined for red fluorescence indicative of BrdU incorporation (white arrowheads in C and G). D is the overlay image of A, B and C, indicating a melanocyte that did not incorporate BrdU during the BrdU labeling, whereas in H, the overlay image of D, E and F shows a different melanocyte that did incorporate BrdU during the BrdU labeling. (I) Quantitative analyses of BrdU incorporation in larvae exposed to MoTP from 4 to 5 dpf. Black and white bars indicate BrdU incorporation in untreated and MoTP-treated larvae, respectively. Horizontal green line indicates periods of BrdU labeling. Asterisk in I indicates the developmental stages at which larvae were sacrificed for BrdU incorporation analysis. Scale bar in A: 10 μm for A-H. |
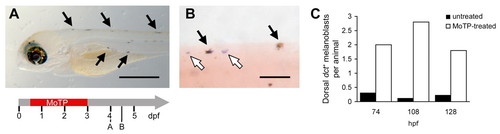
Appearance of dct+ melanoblasts following MoTP-induced melanocyte death. (A,B) Timeline for A and B is shown below A. Lightly pigmented, new melanocytes (black arrow; A,B) and dct+ melanoblasts (white arrows, B) appear 24-36 hours postMoTP treatment. (C) The appearance of the dct+ melanoblasts in the dorsal stripe is specifically induced in the MoTP-treated larvae, average of two to three dct+ melanoblasts per animal examined (white bars), compared with less than 0.3 dct+ melanoblasts (black bars) at equivalent stages in untreated larvae. Eight to 18 animals were analyzed for each bar. Scale bars: in A, 500 μm; in B, 100 μm. EXPRESSION / LABELING:
|

Ventral yolk sac melanocytes fail to regenerate following melanocyte ablation by MoTP treatment. (A) Larval melanocytes were counted in the untreated larvae (blue line) and MoTP-treated (14-72 hpf) larvae (red line). After the appearance of melanocytes at 24 hours post-MoTP treatment, the number of melanocytes continues to steadily rise in the ensuing 4 days and then plateaus at approximately 350-400 melanocytes by 9 dpf (6 days after removal of MoTP). (B-E) At this stage of melanocyte regeneration, MoTP-treated larvae (C,E) have regenerated almost identical pigment patterns to those of the untreated larvae (B,D), with a similar number and distribution of melanocytes in the dorsal, lateral and ventral larval melanocyte stripes (white arrowheads). However, MoTP-treated larvae fail to regenerate the majority of the ventral yolk sac melanocytes (white arrow in C and E). Scale bars: 500 μm. |

Melanocyte regeneration deficit in kitj1e99 larvae. (A) Larval melanocytes were counted in the untreated (blue line) and MoTP-treated (14-72 hpf; red line) kitj1e99 larvae at the permissive temperature (25°C) for the temperature-sensitive allele. The first few melanocytes appear approximately 3 days post-MoTP treatment in the MoTP-treated kitj1e99 animals at 25°C. The number of melanocytes in MoTP-treated larvae reaches approximately 15 by 9 dpf (6 days after removal of MoTP, red line in A), whereas age-matched untreated kitj1e99 animals have approximately 350-400 melanocytes (blue line in A). (B,C) Note that the regenerated melanocytes exhibit a stereotyped spacing morphology in the dorsum (white arrowheads in C). B and C are untreated and MoTP-treated kitj1e99 larvae at 7 dpf, respectively. Scale bar: 500 μm. |