
- Title
-
The transcription factor ZBP-89 controls generation of the hematopoietic lineage in zebrafish and mouse embryonic stem cells
- Authors
- Li, X., Xiong, J.W., Shelley, C.S., Park, H., and Arnaout, M.A.
- Source
- Full text @ Development
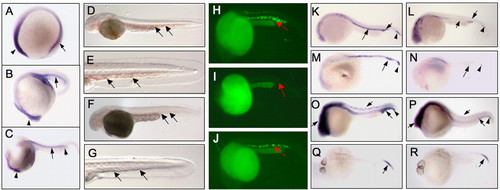
Expression profile of zbp-89 in wild-type zebrafish embryos and the phenotype of zbp-89 morphants. (A-C) Tissue expression of zbp-89 by whole-mount in situ hybridization of 12 hpf (A), 18 hpf (B) and 24 hpf (C) embryos. Lateral views, dorsal upward, anterior to the left are shown. By 12 hpf (A), zbp-89 is expressed in the anterior (arrowhead) and posterior (arrow) lateral plate mesoderm. At 18 hpf (B), it is strongly expressed in the anterior ICM (arrow) and the brain region (arrowhead). At 24 hpf (C), expression in the anterior ICM (arrow) and the wedge region of the anterior ICM (short arrow) is seen together with expression in the brain (arrowhead). No signal was detected with the sense probe (not shown). (D-G) Loss of ZBP-89 results in a bloodless phenotype. DAF staining of 48 hpf whole-mount zebrafish embryos. Blood (arrows) is present in the representative control (mismatch atgMO; D,E) but not in atgMO-injected (F,G) embryos (different embryos are shown in F and G). The bloodless phenotype was present in 78% and 62% of the 100-115 embryos injected at the one- to two-cell stage with either ZBP-89 atgMO or spliceMO, respectively. All views are lateral with anterior left and dorsal top. (H-J). Rescue of zbp-89 morphants by tissue-specific expression of human ZBP-89 under control of the flk1 promoter. Gata1-driven GFP in 22 hpf transgenic (gata1:EGFP) zebrafish embryos that were untreated (H), injected with atgMO only (I) or injected with atgMO plus flk1-ZBP-89 plasmid (J) at the one- to two-cell stage. Single 22 hpf embryos were examined under a fluorescent microscope revealing gata1 expression (red arrows) in the ICM of the untreated (H) and ZBP-89-rescued (J), but not in atgMO only-injected (I), embryos. (K-R) Effect of ZBP-89 knockdown on expression of early hematopoiesis markers. Whole-mount in situ hybridization in wild-type (WT; K,M,O,Q) and ZBP-89-depleted (L,N,P,R) 24 hpf embryos. Embryos were hybridized with digoxigenin-labeled RNA probes for scl (K,L), lmo2 (M,N) and gata2 (O,P). In wild type, scl is expressed in the anterior ICM (K, arrow), posterior ICM (arrowhead in K) and the wedge region of anterior the ICM (K, short arrow). Only minimal expression remains in the wedge region and the posterior ICM in the zbp-89 morphants (L). Lmo2 (M) and gata2 (O) display a similar expression pattern to scl in wild-type embryos, and expression of both is markedly reduced in the ICM of zbp-89 morphants (N and P, respectively). Gata2 is also expressed in the brain and spinal ganglia (short arrows in O,P); its expression at these sites is somewhat reduced by the loss of ZBP-89. (Q,R) Expression of cdx4 in the posterior ICM of 24 hpf wild type (Q) and zbp-89 morphants (R). cdx4 expression is not affected by the loss of ZBP-89. EXPRESSION / LABELING:
|

Expression of hematopoietic and vascular markers in wild type and zbp-89 morphants. (A-R) Expression of primitive erythroid (A-D), primitive myeloid (E-J) and definitive hematopoietic markers (K-R). Normal expression (arrows) of the primitive erythroid genes gata1 (A) and tif1g (C) in the anterior ICM of wild-type embryos is almost completely lost in zbp-89 morphants (B,D, respectively). Expression of tif1g in neural tissue (arrowheads) is not affected. Expression of the primitive myeloid markers pu.1, mpo and l-plastin in wild type (E,G,I) and in zbp-89 morphants (F,H,J). The normal expression of pu.1 in primitive macrophages in the anterior ICM (arrow) in 24 hpf embryos (E) is markedly reduced by depletion of ZBP-89 (F). Its expression is also reduced in 20 hpf embryos in the head, rostral blood islands and ICM (not shown). mpo (G) and l-plastin (I) are normally expressed in the ICM of 24 hpf embryos (arrows) and in the anterior yolk region (l-plastin). Both markers are severely reduced by the loss of ZBP-89 (H,J, respectively). (K-R) Expression of the definitive hematopoietic markers runx1 and c-myb. Expression of runx1 begins in the ICM (K, arrows) at 24 hpf and is well developed in the ventral dorsal aorta at 48 hpf (M, arrows). Loss of ZBP-89 markedly reduces expression of runx1 in 24 hpf (L) and 48 hpf (N) embryos. c-myb is normally expressed in the ICM of wild-type embryos at 24 hpf (O, arrows). In 48 hpf embryos, cells expressing c-myb are found scattered along the ventral wall of the dorsal aorta (Q, arrows), within the first progenitors of definitive hematopoiesis. c-myb expression is significantly reduced in zbp-89 morphants in both 24 and 48 hpf embryos (P,R). Non-hematopoietic expression of runx1 (K,L) and c-myb (O,P) in neural tissue (arrowheads) was not affected by the loss of ZBP-89. (S,T) flk1 expression in 20 hpf wild type and in zbp-89 morphants. flk1 is normally expressed in cells located in two strips of the anterior lateral mesoderm (short arrows), and in the forming anterior (arrows) and posterior (arrowheads) ICM (S). This expression was not affected by the loss of ZBP-89 (T). All views are lateral with anterior left and dorsal top. |
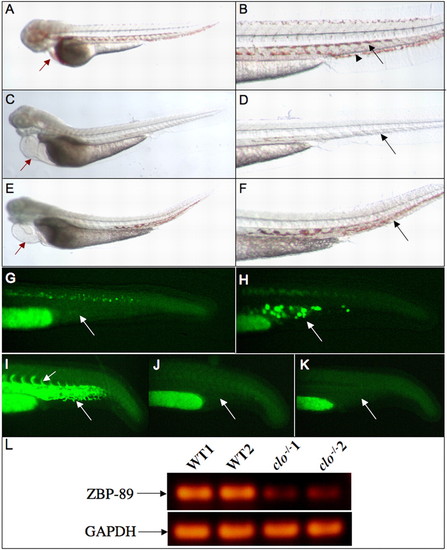
ZBP-89 rescues the hematopoietic but not the vascular phenotype in clo-/- mutant zebrafish embryos. (A,B) Wild-type whole-mount 3 dpf embryos stained with DAF and examined at 4 X (A) and 10 X (B) magnification, showing blood cells in the heart (red arrow), the dorsal aorta (arrow, B) and the posterior cardinal vein (arrowhead, B). (C,D) Clo-/- embryo examined at at 4 X (C) and 10 X (D) magnification. No extravascular or circulating blood is seen. Red arrow in C indicates the dilated bloodless heart. (E,F) ZBP-89 sense RNA injected into clo-/- embryos, shown at two different magnifications. Blood formation in the trunk is evident (arrow in F), but the heart chamber remains dilated and devoid of erythrocytes (E), consistent with the absence of blood vessels. (G,H) Gata1-driven GFP in clo-/- 48 hpf embryos transgenic (Tg) for gata-1:EGFP, before (G) and after (H) overexpression of ZBP-89. Gata1 is found in the GFP-labeled erythroid lineage (arrow in H) in the anterior ICM of clo-/- embryos overexpressing ZBP-89. (I-K) Tg (Flk1:EGFP) 48 hpf embryos showing fluorescence in the axial (arrow in I) and intersomitic (short arrow in I) blood vessels; fluorescence in the yolk extension is nonspecific. (J,K) flk1-driven GFP in clo-/- 48 hpf embryos transgenic for flk1:EGFP before (J) and after (K) overexpression of ZBP-89. Arrows show a lack of blood vessel formation in both cases. (L) ZBP-89 expression profile in two different 18 hpf wild-type (WT1 and WT2) and clo-/- (clo-/-1 and clo-/-2) embryos, assessed using RT-PCR. GAPDH expression was examined simultaneously as a reference. PHENOTYPE:
|
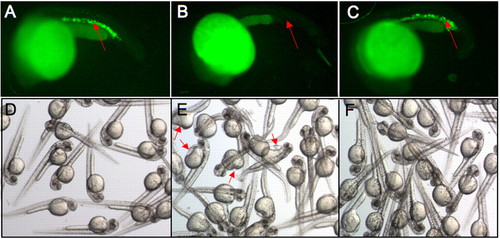
Rescue of zbp-89 morphants by zebrafish scl sense RNA. (A-F) Gata1-driven GFP in 22 hpf transgenic (gata1:EGFP) zebrafish embryos that were untreated (A,D), injected with atgMO only (B,E), or injected with atgMO plus scl RNA (C,F) at the one- to two-cell stage. (A-C) Single 22 hpf embryos examined under a fluorescent microscope revealing gata1 expression (red arrows) in the ICM of the untreated (A) and scl-rescued (C) embryos, but not in the atgMO only-injected (B) embryos. (D-F) Bright-field low magnification images of the respective untreated and treated Tg gata1:EGFP embryos at 48 hpf. Short arrows in E point to pericardial edema in the zbp-89 morphants. PHENOTYPE:
|
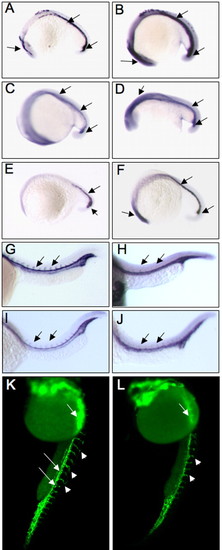
Effect of forced expression of ZBP-89 on hematopoietic and vascular development in zebrafish embryos. (A-J) Wild type (A,C,E,G,I) and ZBP-89-overexpressing (B,D,F,H,J) 18 hpf (A-F) or 24 hpf (G-J) zebrafish embryos. In situ hybridization of wild-type embryos overexpressing ZBP-89 reveals a marked increase in the expression of scl (B), lmo2 (D) and gata1 (F), but a marked reduction in intersomitic expression of the endothelial markers flk1 (H) and tie1 (J), when compared with the respective untreated wild-type embryos (A,C,E,G,I), (K,L) Wild-type (K) and ZBP-89-overexpressing (L) Tg (flk1:EGFP) zebrafish embryos examined at 24 hpf. Overexpression of ZBP-89 caused a significant reduction in flk1 expression in the axial (arrows), brain (short arrow) and intersomitic (arrowheads) blood vessels when compared with the control embryo. EXPRESSION / LABELING:
|
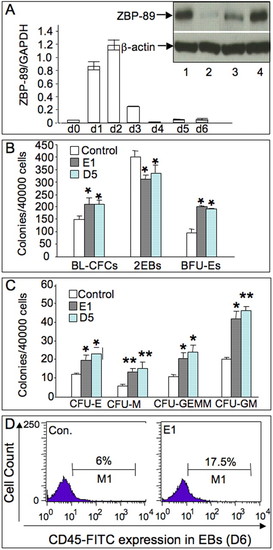
Expression profile of ZBP-89 and effects of its overexpression on hematopoiesis in mouse EB cultures. (A) ZBP-89 expression profile in undifferentiated ESCs and differentiating EBs quantified with real-time PCR. Numbers indicate the day of differentiation. Results represent mean±s.d. of three independent experiments. Inset, western blot analysis showing induction of the ZBP-89 protein mainly in FLK1+ mesoderm precursors in day 3 EBs. Lane 1, positive control; lane 2, uninduced ESCs; lane 3, day 3 FLK1- mesodermal cells; lane 4, FLK1+ mesoderm precursors. Equivalent amounts of cell lysate were loaded per lane as reflected by the β-actin signal. (B) Histograms showing the number of blasts (BL-CFCs), secondary EBs (2°EBs) and primitive erythroid (BFU-Es) colonies generated from control, D5 and E1 clones (bars represent the mean number of colonies±s.d. from two independent experiments). (C) Histograms (mean±s.d., n=3) showing the numbers of definitive erythroid (CFU-E), macrophage (CFU-M), granulocyte-macrophage-megakaryocyte (CFU-GEMM) and granulocyte-macrophage (CFU-GM) colonies. *P<0.01; **P<0.001 (paired t-test). (D) Flow cytometric analysis of a single-cell suspension from E1-derived EBs (see Materials and methods) stained with FITC-labeled rat antimouse CD45 monoclonal antibody. ZBP-89 overexpression significantly increased the number of CD45+ hematopoietic progenitors. |
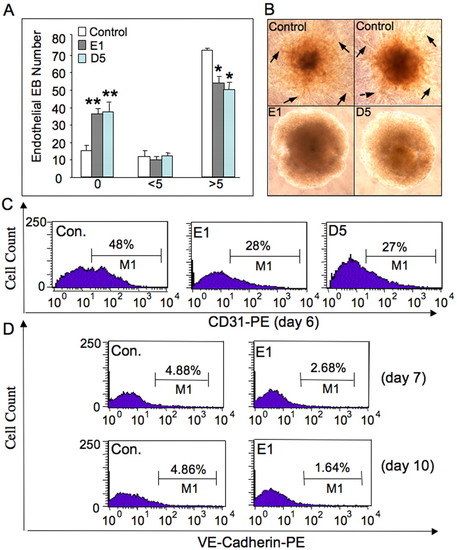
Ectopic expression of ZBP-89 impairs angiogenesis in mouse EB cultures. (A) Primary day 11 EBs were dissociated and cultured in collagen matrix with growth factors for endothelial cell differentiation for four days. Histograms (mean±s.d., n=3) show the number of primary day 11 EBs with 0, <5 or >5 branching vessels/EB derived from the D5 and E1 clones, compared with the control. *P<0.01; **P<0.001; NS, not significant. (B) Representative images of control-, E1- or D5-derived sprouting EB colonies. The reduction in the branching vessels (arrows in controls) in EBs derived from overexpressing ZBP-89 clones E1 and D5 is also clearly reflected by the compactness of the respective colonies; fewer branches are produced compared with the controls. (C,D) Flow cytometric analysis of a single-cell suspension of EBs overexpressing ZBP-89 and stained with PE-labeled anti-CD31 (day 6 culture) or anti-VE-Cadherin (day 7 and day 10 cultures) antibodies. ZBP-89 overexpression significantly reduced the number of CD31+ and VE-Cadherin+ angioblasts (similar results were obtained in two other independent experiments). |

Unillustrated author statements |