
- Title
-
Conserved co-regulation and promoter sharing of hoxb3a and hoxb4a in zebrafish
- Authors
- Hadrys, T., Punnamoottil, B., Pieper, M., Kikuta, H., Pezeron, G., Becker, T.S., Prince, V., Baker, R., and Rinkwitz, S.
- Source
- Full text @ Dev. Biol.

(A) The positions of the six exons of the hoxb3a gene (light blue boxes) and the three exons of the hoxb4a gene (orange boxes) within the hoxba cluster are illustrated. The first exon is shared between the hoxb3a and hoxb4a genes (light blue/orange box). Hoxb3a transcript I (1646 bp; exons 4–6), transcript II (1728 bp; exons 1, 2, 3, 5, and 6), and transcript III (exons 2, 3, 5, 6) code for the same protein. In contrast, the shorter of the two hoxb4a transcripts (II; exons 1 and 3) gives rise to an N-terminal truncated protein. The positions of experimentally verified promoters of hoxb3a and hoxb4a are indicated. (B) Schematic showing from which regions of the cluster sequence the primer pairs were chosen to detect the exon composition of hoxb3a transcripts I and II and hoxb4a transcript II. (C) RT-PCR analyses of hoxb3a and hoxb4a transcripts. PCR results for primer combinations L1 with R2 (hoxb3a transcript II) and L4 with R2 (hoxb3a transcript I) were shown previously (Hadrys et al., 2004). With primer set L5/R3 hoxb3a transcript I sequences corresponding to exons 4–6 were amplified from cDNA preparation. cDNA fragments of transcript II were amplified with primers L6/R3 (exons 2, 3, 5, and 6) and L7/R3 (exons 3, 5, and 6). No PCR products were obtained when using exon 1, exon 2, or exon 3 forward primers (L1, L6, and L7) and an exon 4 reverse primer (R4), indicating that transcripts of these exon compositions, at least in developmental stages 12 hpf, 24 and 33 hpf, do not exist. Hoxb4a transcript II sequences (containing exons 1 and 3, but not exon 2) were amplified using the primers L1/R5, L2/R5, L1/R6, and L2/R6. EXPRESSION / LABELING:
|
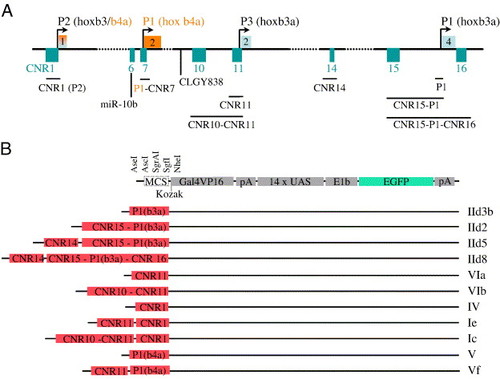
Illustration of PCR-amplified genomic fragments and expression vector design. (A) Locations of conserved non-coding sequences within the hoxb3a/hoxb4a cluster are indicated in turquoise, hoxb4a exons are in orange, and hoxb3a exons in light blue. The first exon is shared between hoxb3a and hoxb4a. Promoters (P) of hoxb3a and hoxb4a are indicated through arrows. Amplified sequences including different CNRs are illustrated below the schematic drawing. The retroviral insertion of zebrafish line CLGY838 and location of micro-RNA miR-10b are also indicated. (B) Fragments that were cloned in the Gal4VP16/UAS/E1b/EGFP expression vector and designation of the constructs. |
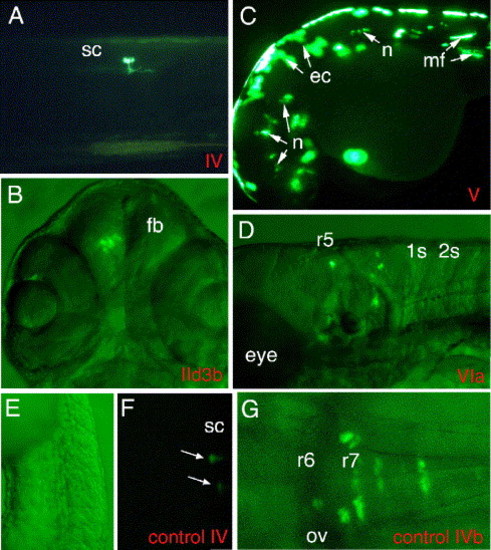
Reporter gene expression driven by hoxb3a and hoxb4a promoter sequences. (A) Construct IV including CNR1 sequences that are located directly upstream of shared exon 1 (hoxb3a and hoxb4a P2; Figs. 1A and 2) displayed weak basal promoter activity within the trunk in single mesodermal and neuronal cells; larva 72 hpf is shown. (B) EGFP reporter gene activity driven by hoxb3a P1 (construct IId3b) within the forebrain of a 72-hpf larvae. Combined fluorescent and bright field illumination. (C) An embryo of 48 hpf injected with the hoxb4a P1 reporter construct (V) is shown. This construct included a 1kb sequence immediately upstream of hoxb4a exon 2 (hoxb4a transcript I; Fig. 1 and Fig. 2) and displayed strong promoter activity. Mosaic EGFP expression was observed in neuronal, mesodermal, and epithelial cells throughout the whole embryo. (D) A sequence located within CNR11, directly upstream of hoxb3a exon 2 (Fig. 1 and Fig. 2), revealed promoter activity and drove EGFP expression in the posterior hindbrain derived from r5 through r7 and r8 and spinal cord. Combined fluorescent and bright field illumination is documented. (E–G) To confirm that the enhancers act through the endogenous hoxb3a/hoxb4a promoters and not through the E1b promoter located 52 of the EGFP coding sequence, we removed the Gal4VP16/UAS/E1b cassette from constructs IV (hoxb3a/hoxb4a P2) and VIb (hoxb3a P3-CNR10/CNR11 enhancer). Injection of these constructs resulted in much lower EGFP levels compared to the Gal4/UAS constructs, resulting in a lower rate of total EGFP expressing embryos and in a lower rate of neuronal expression (compare in Table 3). Panel E is bright field to panel F. (F) Embryo 24 hpf, injected with control construct IV that has EGFP label within the spinal cord. (G) Larva 48 hpf injected with control construct VIb. Abbreviations: ov, otic vesicle; r, rhombomere; sc, spinal cord. |
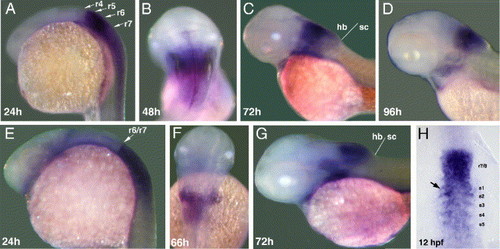
Whole mount in situ hybridization with hoxb3a exon 6 (A–D) and hoxb4a exon 3 (E–H) probe. (A) Hoxb3a transcript distribution in r5 and r6 extending posterior into the spinal cord in 24 hpf embryos. (B–D) Gene expression proceeds within the hindbrain, strongest on former r4 to r6 level, in 48 hpf (B), 72 hpf (C), and 96 hpf (D) larvae. (E) Hoxb4a is expressed within the spinal cord and in r7 and r8 with a sharp border at the boundary between r6 and r7 in embryos at 24 hpf. (F and G) Expression domain in later development becomes increasingly confined to the posterior hindbrain in 66 hpf (F) and 72 hpf (G) larvae. (H) Somitic expression of hoxb4a in early embryos. Abbreviations: hb, hindbrain; r, rhombomere; sc, spinal cord. EXPRESSION / LABELING:
|

Whole mount in situ hybridization of 24 hpf (A–C) and 48 hpf (D–F) zebrafish embryos using probes specific for hoxb3a transcript I (exon 4; column 2), transcript II/III (exons 1–3; column 3), and exon 6 that is included in all hoxb3a transcripts (column 1). Transcript I is expressed in r5 and r6 (B and E), whereas transcript II/III is expressed in r7 and r8 (C and F) and posterior. All three transcripts resemble the known expression pattern of zebrafish hoxb3a (A and D; Prince et al. 1998). In panels G to R, vibratome sections (30 μm) from anterior to posterior through the hindbrain of hybridized 48 hpf embryos are shown. (G, J, M, and P) Embryos were hybridized with an exon 6 probe; (H, K, N, and Q) embryos were hybridized with an exon 4 probe; (I, L, O, and R) embryos were hybridized with an exons 1–3 probe. The levels of sections (r5, r6, r7/r8, and spinal cord) are indicated left of each row. Abbreviations: r, rhombomere; sc, spinal cord; ov, otic vesicle. Arrows point to hindbrain expression domains. |

The regulatory function of the genome region that includes CNR10 and CNR11 was investigated. (A) CNR11 in the context of hoxb4a P1 (construct Vf; Fig. 2) repressed the broad activity of the hoxb4a P1 fragment and enhanced r7 and r8 EGFP expression. Clear neural expression was first detected at 24 hpf in single neurons within hindbrain r7, r8, and spinal cord. A 3-dpf larva is shown that has EGFP label in r7 and r8 as well as in single muscle fibers. (B) CNR11 acts also as a neural enhancer in r7 and r8 when combined with hoxb3a/hoxb4a P2 (CNR1) that alone mediates only very weak transcriptional activity within the spinal cord (compare Fig. 3A, Table 3). (C and D) A 2.3-kb genome fragment that included CNR10 and CNR11 (Fig. 2) in combination with hoxb3a/hoxb4a P2 (CNR1) drove strong EGFP expression up to the r6/r7 boundary within r7 and r8 and within the spinal cord. Also muscle fibers were labeled. (E) When CNR1 was excluded from the construct and the hoxb3a transcript III promoter sequence that is included in CNR11 (hoxb3a P3) was used to drive Gal4 expression, the anterior EGFP expression boundary was moved anteriorly. EGFP-labeled neurons were observed in r5 and r6, but never in r4. (F and G) 30-μm vibratome sections through embryos that expressed the CNR10/11 reporter gene construct and were stained with an anti GFP antibody, on level of former r5 (F), and on former r7 level (G). (H) Schematic illustration of the types of neurons that were observed by injection of the hoxb3a/hoxb4a P2-CNR10/CNR11 reporter construct (Ic). (J) Types of neurons that were observed with the CNR10/CNR11 (hoxb3a P3) construct (VIb). Abbreviations: n, neuron; ov, otic vesicle; r, rhombomere; s, somite. |
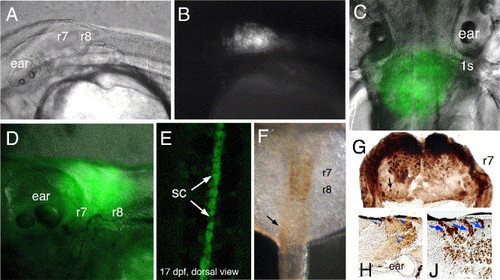
Zebrafish line CLGY838 with viral-YFP insertion 870 bp upstream of CNR10 (compare Fig. 2). Expression of YFP becomes progressively stronger during zebrafish development as shown here (A, B) for 32 hpf embryos, (C) 4 dpf, and (D) 10 dpf larvae. YFP expression domain includes r7 and r8 extending into the posterior r6, here forming a diffuse boundary. (E) Spinal cord expression in 17-dpf larva from dorsal view. (F) Antibody stained 32 hpf embryo reveals r7 and r8 expression and low YFP levels within the somitic mesoderm. (G) Coronal section through hindbrain r7 of 4-day-old larva stained with an antibody against GFP. YFP expressing cells are localized in the dorsomedial region, note also single neurons that are stained in the ventral area (arrows). (H and J) Sagittal sections through 26 dpf larva stained by anti-GFP immunohistochemistry. (H) Section through the lateral hindbrain. Blue arrows point to neuronal cell clusters and single cells. (J) Section through the medial hindbrain. Hoxb4a expressing cells in the dorsomedial hindbrain form a stripe pattern (blue arrows) suggesting streams of migrating cells. Abbreviations: r, rhombomere; s, somite; sc, spinal cord. |
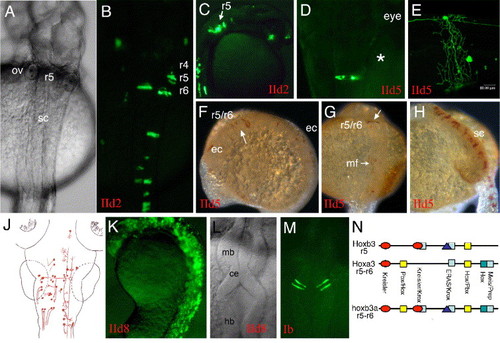
(A to J) Sequences upstream of hoxb3a exon 4 (part of transcript I) were tested for enhancer activity in combination with the endogenous hoxb3a P1. Construct IId2 included 1.7 kb upstream of exon 4 and contained the CNR15 (Fig. 2). This fragment was capable of directing strong mosaic EGFP expression within the spinal cord and hindbrain up to the r4/r5 boundary. When CNR14 was included into the construct (IId5), the same expression pattern was observed. Labeled embryos shown in pictures A to J are representative for the types of EGFP expressing neurons that were observed with both constructs. (A, B) Embryo 30 hpf, dorsal view. (C) Embryo 27 hpf, sagittal view. (D) EGFP-labeled neuron in r7 of a larva at 2 dpf. (E) EGFP-labeled spinal cord neuron with its axons surrounding and innervating the yolk. (F–H) IId5-injected embryos stained by anti-GFP immunohistochemistry. (F) 10 somite stage (14 hfp) embryo with EGFP expression in clonal strings within r5 and r6 and posterior. (G) 20 somite stage (19 hpf) embryo with r5 and r6 and muscle fiber label. (H) 24 hpf embryo displaying strong label in clonal strings within the spinal cord. (J) Illustration of the types of neurons that were EGFP labeled. (K) CNR14 was analyzed together with a CNR15/CNR16 fragment (IId8; Fig. 2). (L and M) Activity of the mouse CNR15 enhancer in clonal strings within the anlage of the cerebellum is shown. This enhancer mediated activity within the central nervous system, but was not able to set an anterior expression boundary within the hindbrain. (N) Schematic illustration of the structural similarities of zebrafish hoxb3a r5–r6 enhancer (CNR15) with mouse Hoxa3 r5–r6 and mouse Hoxb3 r5 enhancer sequences (compare Manzanares et al., 1999 and Hadrys et al., 2004). Abbreviations: ce, cerebellum; ec, epithelial cells; hb, hindbrain; mb, midbrain; ov, otic vesicle; r, rhombomere; sc, spinal cord. |
Reprinted from Developmental Biology, 297(1), Hadrys, T., Punnamoottil, B., Pieper, M., Kikuta, H., Pezeron, G., Becker, T.S., Prince, V., Baker, R., and Rinkwitz, S., Conserved co-regulation and promoter sharing of hoxb3a and hoxb4a in zebrafish, 26-43, Copyright (2006) with permission from Elsevier. Full text @ Dev. Biol.