
- Title
-
Endothelium is required for the promotion of interrenal morphogenetic movement during early zebrafish development
- Authors
- Liu, Y.W., and Guo, L.
- Source
- Full text @ Dev. Biol.
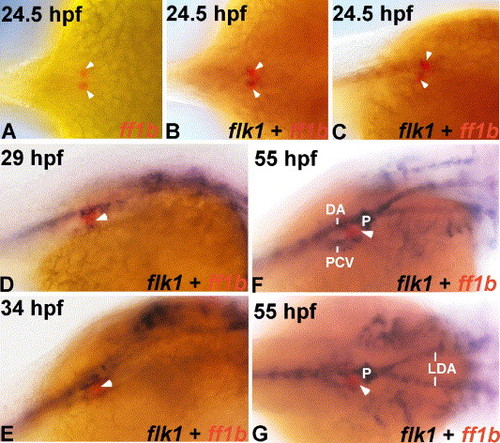
Spatial relationship between interrenal tissue and endothelium during early zebrafish development. Developing wild type embryos at 24.5 hpf (A–C), 29 hpf (D), 34 hpf (E) and 55 hpf (F, G) were subject to either single ISH for ff1b (red) (A), or double ISH for flk1 (dark blue) and ff1b (red) (B–G). Panels A, B and G are dorsal views, while panels C–F are dorsolateral views of the trunk region. All panels are oriented with anterior to the right. The tight association between interrenal tissue and endothelium initiates before the convergence of interrenal primordia. DA, dorsal aorta; PCV, posterior cardinal vein; P, pronephros; LDA, lateral dorsal aortae. White arrowheads indicate the interrenal tissues. |
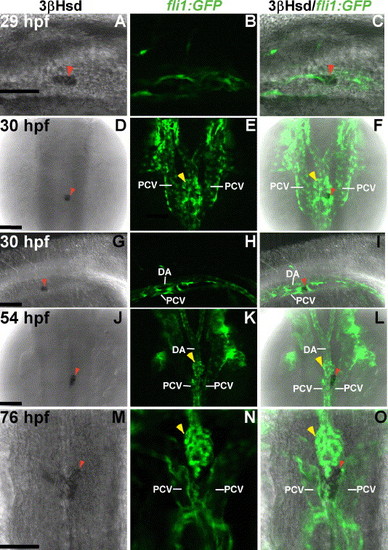
Interaction of interrenal and endothelial cells as revealed in Tg(fli1:EGFP)Y1 transgenic zebrafish. Single confocal sections showing the interrenal tissues as stained by 3β-Hsd activity assay (left panel: A, D, G, J, M), and the neighboring ECs as labeled by green fluorescence (middle panel: B, E, H, K, N), of Tg(fli1:EGFP)Y1 embryos while staged at 29 hpf (A–C), 30 hpf (D–I), 54 hpf (J–L) and 76 hpf (M–O), respectively. The merged images of 3β-Hsd activity and GFP are shown in the right panel (C, F, I, L, O). Panels A–C and panels G–I are lateral views with anterior oriented to the right. Panels D–F and panels J–O are dorsal views with anterior oriented to the top. The interrenal cells are in close contact with ECs that are engaged in axial vessel assembly. DA, dorsal aorta; PCV, posterior cardinal vein. Red arrowheads indicate interrenal tissues, while yellow arrowheads indicate glomeruli. Scale bar, 50 μM. EXPRESSION / LABELING:
|
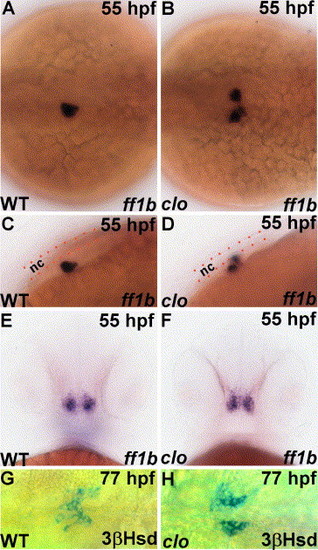
ff1b expression and 3β-Hsd enzymatic activity in the clom39 mutant and its wild type sibling. Embryos of clom39 mutant (right panel: B, D, F, H) and its wild-type sibling (WT, left panel: A, C, E, G) were labeled by ISH for ff1b (dark blue) at 55 hpf (A–F), or by chromogenic detection of 3β-Hsd activity at 77 hpf (G, H). Panels A and B are dorsal views while panels C and D are dorsolateral views of embryos oriented with anterior to the right. Panels E and F are frontal views showing the ff1b expression in ventral hypothalamus. Panels G and H are ventral views of deyolked embryos oriented with anterior to the right. The central migration of interrenal tissue is arrested in clom39, resulting in persistent distribution of a pair of cell clusters on either side of notochord. Notochords (nc) dorsal to the interrenal tissues are outlined by red dots in panels C and D. EXPRESSION / LABELING:
|

Migration of pronephros and chromaffin tissues in the clom39 mutant and its wild type sibling. Pronephros and interrenal tissues in clom39 (B) and its wild type sibling (WT, A) at 55 hpf were detected by double ISH for wt1 (dark brown) and ff1b (red), respectively. Interrenal and chromaffin tissues in clom39 (D) and its wild type sibling (C) at 77 hpf were detected by double ISH for ff1b (blue) and dβh (dark brown), respectively. All panels are dorsal views oriented with anterior to the left. The central merge of pronephric primordia is defective in clom39, while the migration and coalescence of chromaffin tissues are unperturbed. EXPRESSION / LABELING:
|
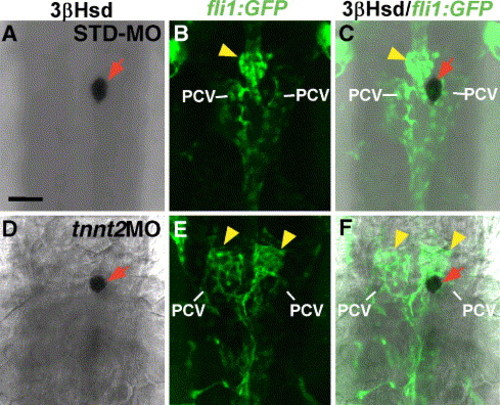
Effects of tnnt2 antisense morpholino injection on the interrenal tissue. Single confocal sections showing the interrenal tissues as detected by 3β-Hsd activity staining (left panel: A, D), and the neighboring ECs as labeled by green fluorescence (middle panel: B, E), of 56 hpf Tg(fli1:EGFP)Y1 embryos injected with STD-MO (A–C) and tnnt2MO (D–F), respectively. The merged images of 3β-Hsd activity and GFP are shown in the right panels C and F. All panels are dorsal views with anterior oriented to the top. The convergence of glomerular but not interrenal tissues is perturbed in tnnt2 morphants. PCV, posterior cardinal vein. Red arrows indicate interrenal tissues, while yellow arrowheads indicate glomeruli. Scale bar, 50 μM. EXPRESSION / LABELING:
|
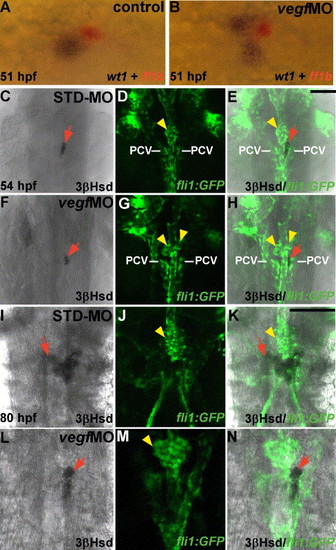
Effects of vegf-A antisense morpholino injection on the interrenal tissue. (A, B) Dorsal views of uninjected control (A) and vegf-A morphant (B) embryos after double ISH for wt1 (dark brown) and ff1b (red) at 51 hpf, oriented with anterior to the left. (C–N) Single confocal sections showing the dorsal views of interrenal tissues as detected by 3β-Hsd activity staining (C, F, I, L), and the neighboring ECs as labeled by green fluorescence (D, G, J, M), of 54 hpf (C–H) or 80 hpf (I–N) Tg(fli1:EGFP)Y1 embryos injected with STD-MO (C–E, I–K) and vegfMO (F–H, L–N), respectively and oriented with anterior to the top. The merged images of 3β-Hsd activity and GFP are shown in panels E, H, K and N. The convergence of pronephric but not interrenal tissues is perturbed in vegf-A morphants. PCV, posterior cardinal vein. Red arrows indicate interrenal tissues, while yellow arrowheads indicate glomeruli. Scale bar, 50 μM. EXPRESSION / LABELING:
|
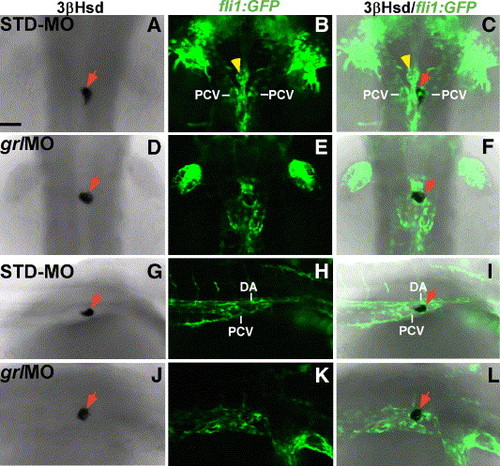
Effects of grl antisense morpholino injection on the interrenal tissue and its neighboring vasculature. Single confocal sections showing the interrenal tissues as detected by 3β-Hsd activity staining (left panel: A, D, G, J), and the neighboring ECs as labeled by green fluorescence (middle panel: B, E, H, K), of 56 hpf Tg(fli1:EGFP)Y1 embryos injected with STD-MO (A–C, G–I) and grlMO (D–F, J–L), respectively. The merged images of 3β-Hsd activity staining and GFP are shown in the right panels C, F, I and L. Panels A–F are dorsal views with anterior oriented to the top, while panels G–L are dorsolateral views with anterior to the right. The disruption of dorsal aorta through injection of grl morpholino does not significantly perturb the interrenal convergence. DA, dorsal aorta; PCV, posterior cardinal vein. Red arrows indicate interrenal tissues, while yellow arrowheads indicate glomeruli. Scale bar, 50 μM. EXPRESSION / LABELING:
|
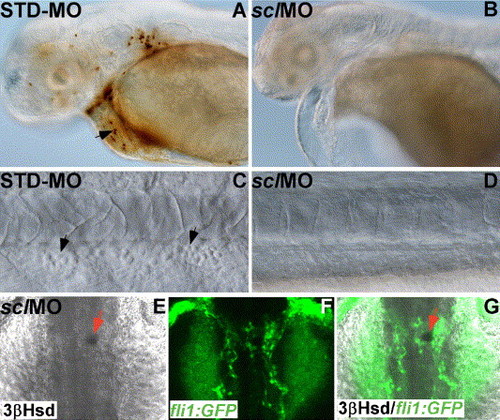
Effects of scl antisense morpholino injection on the interrenal tissue. (A–D) Lateral views of embryos injected with STD-MO (A, C) and sclMO (B, D), respectively, harvested at 51 hpf, and subject to either DAF staining (A, B) or no staining (C, D) prior to Nomarski photomicroscopy. Blood cells are present in the anterior portion (A) and tail vessels (C) of STD-MO-injected embryos, but not detected in the scl morphants (B, D). (E–G) Single confocal sections showing the dorsal views of interrenal tissues as stained by 3β-Hsd activity assay (E), and neighboring ECs as labeled by green fluorescence (F), of 53 hpf Tg(fli1:EGFP)Y1 embryos injected with sclMOs. The merged images of 3β-Hsd activity and GFP are shown in panel G. Anterior is oriented to the left in panels A–D and to the top in panels E–G. The central convergence of interrenal tissues is not affected in scl morphants where blood cells are absent. Black arrows indicate blood cells, and red arrows indicate interrenal tissues. EXPRESSION / LABELING:
|
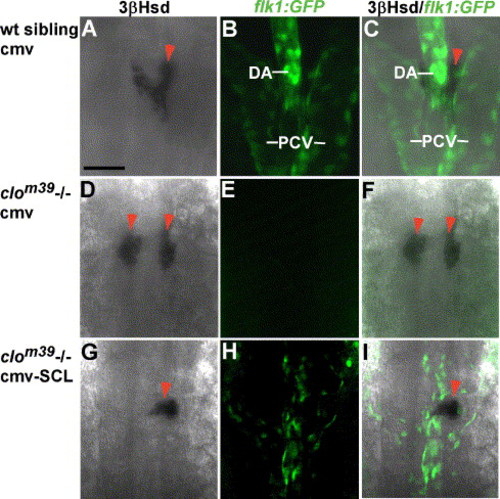
Effects of forced expression of SCL on the trunk endothelium and interrenal tissue in Tg(flk1:EGFP)s843;clom39 mutants. Single confocal sections showing the interrenal tissues as detected by 3β-Hsd activity staining (Left panel: A, D, G), and the neighboring ECs as revealed by green fluorescence from Tg(flk1:EGFP)s843 background (B, E, H), of 78 hpf homozygous clom39 mutants (D–I) and their wild-type siblings (A–C), injected either with pCS2+ plasmid control (cmv; A–F) or pCS2+SCL (cmv-SCL; G–I). The merged images of 3β-Hsd activity staining and GFP are shown in the right panel (C, F, I). All panels are dorsal views with anterior oriented to the top. The trunk vasculature as well as interrenal phenotypes of wild-type siblings being injected with cmv-SCL were essentially not varying from those injected with cmv, and are hence not shown. The defective fusion of bilateral interrenal primordia in clom39 is alleviated while the trunk endothelium is partially rescued. DA, dorsal aorta; PCV, posterior cardinal vein. Red arrowheads indicate interrenal tissues. Scale bar, 50 μM. |
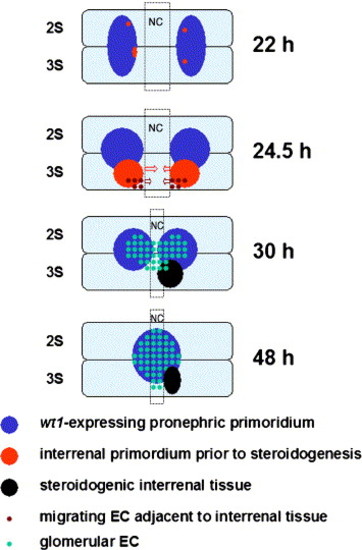
The early morphogenetic movement of interrenal tissue is guided by ECs. The parallel migrations of interrenal tissue and pronephros in this schematic are depicted based on the results of this study and Hsu et al. (2003). The panels represent dorsal top views of embryos, at the indicated stages, oriented with anterior to the top. The earliest association of interrenal tissue with ECs was detected at 24.5 hpf by ISH, while no interrenal-EC interaction was detected at 22 hpf, when the primitive interrenal cell clusters resided in the pronephric field. The steroidogenesis of interrenal tissue, after migration and convergence, is correlated temporally with the angiogenesis of pronephros. The assembly of axial vasculature near pronephric-interrenal region is omitted from this diagram. NC, notochord; 2S and 3S, the second and third somite, respectively. |
Reprinted from Developmental Biology, 297(1), Liu, Y.W., and Guo, L., Endothelium is required for the promotion of interrenal morphogenetic movement during early zebrafish development, 44-58, Copyright (2006) with permission from Elsevier. Full text @ Dev. Biol.