
- Title
-
PPM1A functions as a Smad phosphatase to terminate TGFbeta signaling
- Authors
- Lin, X., Duan, X., Liang, Y.Y., Su, Y., Wrighton, K.H., Long, J., Hu, M., Davis, C.M., Wang, J., Brunicardi, F.C., Shi, Y., Chen, Y.G., Meng, A., and Feng, X.H.
- Source
- Full text @ Cell

Dynamic Phosphorylation and Dephosphorylation of Smad2/3 (A) Time course of Smad2/3 phosphorylation. HaCaT cells were treated with 2 ng/ml of TGFβ1 for the indicated time periods. P-Smad2/3 and total Smad2/3 were analyzed by Western blotting. Left: Line graph representing three independent experiments. Intensity of P-Smad2/3 relative to total Smad2/3 from each experiment was quantified by NIH Image software. Values are the mean of at least two independent experiments; error bars are ± standard deviation of the mean. Right: A representative Western blot. (B) A schematic representation of treatments designed for (C)–(F). (C) Analysis of Smad2 dephosphorylation. HaCaT cells were treated with 2 ng/ml of TGFβ1 for 30 min, followed by TGFβ washout and simultaneous addition of 5 μM SB431542 and 20 μM MG-132. Graph shows relative P-Smad2 level (over total Smad2) from three independent experiments, with values and error bars representing mean and standard deviation. The insert is one representative experiment. (D) Experiments equivalent to (C) analyzing Smad3 dephosphorylation in HaCaT cells. (E) Effect of okadaic acid (OA) on TGFβ-dependent phosphorylation of Smad2/3. HaCaT cells were treated with TGFβ1 and SB431542 as in (C); in a separate group of cells, 5 nM OA was added 3.5 hr before TGFβ and continued with TGFβ and SB431542 treatment (for a total of 8 hr). Graphical analysis of relative P-Smad2/3 levels is presented here (line graph) and in Figure S2A. Values are mean of three independent experiments; error bars are ± standard deviation of the mean. (F) Effect of OA on TβRI(T204D)-induced phosphorylation of Smad2/3. HaCaT cells were infected with AdTβRI(T204D) adenoviruses at moi of 200. After 48 hr, cells were treated with 5 μM SB431542. Five nanomolar OA was added 3.5 hr before SB431542 addition and remained with SB431542. Graphical analysis of relative P-Smad2/3 levels is presented here (line graph) and in Figure S2B. Values and error bars are mean and standard deviation of three independent experiments. |

PPM1A Dephosphorylates Smad2 and Smad3 (A) Smad2 dephosphorylation by PPM1A. In transfected 293T cells, Flag-Smad2 was anti-Flag immunoprecipitated, and levels of P-Smad2 and total Smad2 were assessed by Western blotting. (B) PPM1A dephosphorylates Smad3 in 293T cells. (C) PPM1A reduces endogenous P-Smad2/3 levels. HaCaT cells were transfected with PPM1A, treated with TGFβ (2 ng/ml, 1 hr), and immunostained using anti-PPM1A (Texas red) and P-Smad2 or P-Smad3 (FITC). Arrow indicates reduced P-Smad2/3 in PPM1A-transfected cells. (D) Smad2 dephosphorylation requires the catalytic activity of PPM1A. (E) Smad2 dephosphorylation occurs in the presence of MG-132. Flag-PPM1A or His-PPM1A is as efficient as PPM1A. (F) PPM1A dephosphorylates P-Smad2 MH2 domain (P-S2MH2). Dephosphorylation of P-S2MH2 required 20 mM Mg2+ (lane 2) and was abolished by 40 mM EDTA (lane 4). Equal amounts of semisynthetic recombinant P-S2MH2 (100 ng, lanes 1–4) and recombinant PPM1A (100 ng, lanes 2–4) were loaded. (G) Smad2 dephosphorylation by PPM1A depends on 20 mM Mg2+ (lane 3), but not 2 mM Mn2+ (lane 4) or 20 mM Ca2+ (lane 5). (H) Smad2 dephosphorylation by λ phosphatase (λPPase). (I) PPM1A specifically dephosphorylates the SXS motif, but not pS212 of Smad3. Linker phosphatase specifically dephosphorylates pS212, but not the SXS motif. |

PPM1A Interacts with Smad2 (A) Coimmunoprecipitation of Flag-PPM1A and HA-Smad2 in 293T cells. IP, immunoprecipitation; IB, Western blotting; WCL, whole-cell lysates. (B) Endogenous PPM1A-Smad2 interaction is TGFβ inducible. HaCaT cells were treated with TGFβ1 (1 hr), and cell lysates were subjected to IP using anti-PPM1A (lane 5 and 6) or a control mouse antibody (lane 4). (C) Smad2(V398R) mutant interacts with PPM1A in 293T cells. (D) Subcellular colocalization of PPM1A and Smad2 in HaCaT cells. Smad2 and PPM1A proteins were detected by using anti-Smad2 (FITC) and anti-PPM1A (Texas red) antibodies. DNA was stained using DAPI dye. (E) PPM1A is primarily localized in the nucleus. Left: HaCaT cells treated with TGFβ1 (2 ng/ml for 1 hr) were crosslinked with formaldehyde before fractionation and Western blotting analysis (Supplemental Data). C, cytoplasmic fraction; N, nuclear fraction. Right: NIH 3T3 cells. (F) Direct interaction of PPM1A with Smad2/3. Purified recombinant His-PPM1A or His-D239N protein bound to recombinant GST-Smad2 (lanes 4 and 7) or Smad3 (lanes 5 and 8) but not GST alone (lanes 3 and 6) was detected by anti-PPM1A Western blotting. (G) PPM1A exclusively binds to P-Smad2. Recombinant Smad2 MH2 (aa 241–467), phosphorylated (lane 1) or unphosphorylated (lane 2), bound to recombinant His-PPM1A protein was detected by Western blotting. |

PPM1A Regulates Phosphorylation, Oligomerization, and Nuclear Export of Smads (A) Specific PPM1A knockdown in 293T cells. Flag-hPPM1A, Flag-tagged human PPM1A; Flag-zPPM1A, Flag-zebrafish PPM1A; h, shPPM1A494 against human PPM1A; m, shmPPM1A494 against mouse PPM1A. The level of P-Smad2 was inversely correlated with that of PPM1A. (B) Reduced Smad2/3 dephosphorylation in HaCaT-shPPM1A cells. Left: Cells were treated with TGFβ and SB431542 and analyzed as described in Figure 1C. Right: Line graph showing relative levels of P-Smad2/3 over those of total Smad2/3 from three independent clones with two experiments each, with values and error bars representing the average and standard deviation. (C) qRT-PCR analysis of PPM1A mRNA in shPPM1A cells. Values and error bars represent mean and standard deviation of two experiments (each with triplicates). (D) Stable PPM1A depletion increases Smad2 phosphorylation and association with Smad4. HaCaT-shPPM1A or control cells were treated with TGFβ (2 ng/ml, 1 hr). Nuclear and cytoplasmic fractions (Supplemental Data) were subjected to anti-Smad4 IP and Western blotting. (E) PPM1A depletion increases Smad2 accumulation in the nucleus. Cells were treated with TGFβ for 1 hr and then with SB431542 for 0.5, 1, 2, or 4 hr. Smad2 was visualized using anti-Smad2 antibody (FITC). DAPI (DNA staining) and merge are indicated. (F) Wild-type PPM1A (WT), but not D239 mutant (DN), causes Smad2/3-Smad4 dissociation. (G) PPM1A promotes nuclear export of Smad2. An MS2-based quantitative analysis of nuclear transport assay system was used (Supplemental Data). Values and error bars represent mean and standard deviation of three experiments. |

Loss of PPM1A Promotes TGFβ Signaling (A) Loss of PPM1A enhances TGFβ antiproliferative response in HaCaT cells. DNA synthesis in shPPM1A cells and control cells was determined by [3H]thymidine incorporation assay. Values and error bars represent the mean and standard deviation of two experiments. (B) Enhanced expression of p15 in shPPM1A cells as assessed by qRT-PCR. Values and error bars represent the mean and standard deviation of two experiments (likewise for all qRT-PCR analyses below). (C) Increased p15 promoter activity in shPPM1A cells. Values and error bars represent the mean and standard deviation of at least three experiments (likewise for all reporter analyses below). (D) qRT-PCR analysis of p21 in HaCaT cells. (E) Inhibitors of p38, PI3K, and GSK3 have no or minimal effect on the basal level of p21 mRNA. Cells were treated with inhibitors of p38 kinase (10 μM SB202190), PI3K (10 μM LY294002), and GSK3 (2 μM SB216763) for 3 hr before TGFβ treatment and RNA analysis. (F) Smad2/3 mediate increased levels of both basal and inducible p21 promoter activity. pSRG-shS2/3 simultaneously express shSmad2 and shSmad3. pSRG is an empty vector. (G) qRT-PCR analysis of c-myc in HaCaT cells. (H) qRT-PCR analysis of PAI-1 in HaCaT cells. (I) Increased PAI-1 promoter activity in shPPM1A cells. (J) qRT-PCR analysis of FN in HaCaT cells. (K) PPM1A does not influence GAPDH mRNA level. |
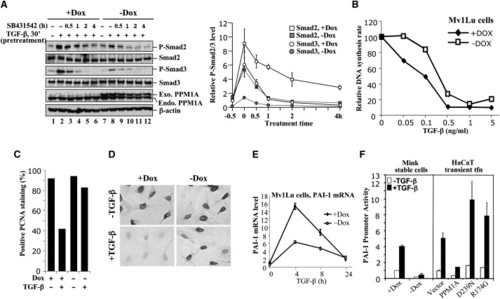
Inducible Expression of PPM1A Causes TGFβ Resistance(A) Reduced Smad2/3 phosphorylation in Mv1Lu cells with inducible expression of PPM1A. Mv1Lu-tet-off cells stably harboring Flag-PPM1A were grown with (+) or without (−) 10 ng/ml of doxycycline (Dox). Left: Induced expression of Flag-PPM1A (lanes 7–12). Cells were pretreated with TGFβ for 30 min (lanes 2 and 8) and then SB431542 for the indicated time periods (lanes 3–6 and 9–12). Levels of P-Smads, total Smads, and PPM1A were detected by Western blotting. Right: Line graph representing data from two stable clones with two experiments each, with values and error bars representing mean and standard deviation. (B) PPM1A causes partial TGFβ resistance. Mv1Lu-PPM1A cells were cultured ±Dox, treated with various doses of TGFβ, and subjected to [3H]thymidine incorporation to analyze DNA synthesis. (C) PPM1A blocks the TGFβ antiproliferative response. Mv1Lu-PPM1A cells, cultured ±Dox and treated ±TGFβ (0.2 ng/ml, 12 hr), were stained for PCNA (Zymed). PCNA-positive (black) and -negative (light gray) cells were counted and plotted. (D) A representative field of PCNA staining as in (C). (E) qRT-PCR analysis of PAI-1 in Mv1Lu cells. Values and error bars represent the mean and standard deviation of two experiments. (F) PPM1A inhibits PAI-1 promoter activity. Left: Stable Mv1Lu cells were transfected with p800-luc and grown with (+) or without (−) Dox. Right: HaCaT cells were transiently transfected with p800-luc and PPM1A expression plasmids. Values and error bars represent the mean and standard deviation of at least three experiments. |
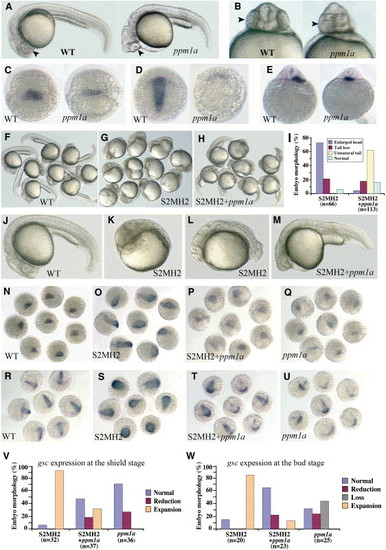
Function of PPM1A in Zebrafish Embryos(A) Lateral view of live embryos at 24 hpf (hours postfertilization). Right: Embryo injected with 300 pg of ppm1a mRNA. Eyes are indicated by arrowhead. (B) Ventral view of embryos shown in (A). Note that eyes (arrowhead) were fused in the ppm1a-injected embryo. (C–E) Embryos injected with 400 pg of ppm1a mRNA resulted in decreased gsc expression in the shield (C), loss of gsc expression in the prechordal plate (D), and mislocalization of lefty2 expression domain (heart) in the right at 24 hpf (E). Embryos were dorsal views with the animal pole at the top (C and D) or ventral views of heads (E). (F–M) Embryos injected with 5 ng of S2MH2 protein exhibited head enlargement (G and K) and/or tail loss (G and L) at 24 hpf. Coinjection with 400 pg of ppm1a mRNA allowed a majority of embryos to develop an abnormal tail at 24 hpf (H and M). Statistical data are shown in (I). (N–Q) gsc expression at the shield stage. Dorsal views of embryos injected with 5 ng of S2MH2 and/or 400 pg of ppm1a mRNA are shown. Note that the gsc-inducing effect of S2MH2 was counteracted by ppm1a. (R–U) gsc expression at the bud stage. Experiments were done similarly to in (N)–(Q). (V and W) Statistical data for gsc expression as shown in (N)–(U). Embryos were classified, based on degree of change in gsc expression, into four categories: normal, reduction, loss (loss in the prechordal plate), and expansion. |
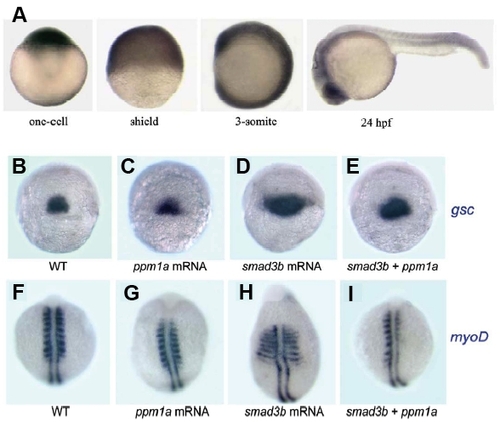
Expression Pattern and Smad3-Antagonizing Activity of PPM1A (A) Spatiotemporal expression pattern of PPM1A at different stages, detected by whole-mount in situ hybridization. Note that PPM1A transcripts are present ubiquitously. (B-I) Dorsal views showing gsc (B-E) expression at the shield stage and and myoD (E-I) at the 10-somite stage. mRNA species used for injection were indicated below each picture. WT, uninjected wildtype embryo. Injection with 50 pg Smad3b mRNA caused expansion of gsc expression at the shield stage in 63.4% (n=41) of embryos (D) and ventral expansion of the myogenic marker myoD in somites at the 10-somite stage in 64.5% (n=62) of embryos (H), indicating a dorsalizing effect of Smad3b. When the same amount of Smad3b mRNA and 300 pg PPM1A mRNA were coinjected, embryos with expanded gsc and myoD expression decreased to 30% (n=40) and 11.3% (n=71), respectively (E, I). These data indicate that effect of Smad3b expression can be inhibited by excess PPM1A in vivo. |
Reprinted from Cell, 125(5), Lin, X., Duan, X., Liang, Y.Y., Su, Y., Wrighton, K.H., Long, J., Hu, M., Davis, C.M., Wang, J., Brunicardi, F.C., Shi, Y., Chen, Y.G., Meng, A., and Feng, X.H., PPM1A functions as a Smad phosphatase to terminate TGFbeta signaling, 915-928, Copyright (2006) with permission from Elsevier. Full text @ Cell