
- Title
-
Comparison of neurolin (ALCAM) and neurolin-like cell adhesion molecule (NLCAM) expression in zebrafish
- Authors
- Mann, C.J., Hinits, Y., and Hughes, S.M.
- Source
- Full text @ Gene Expr. Patterns
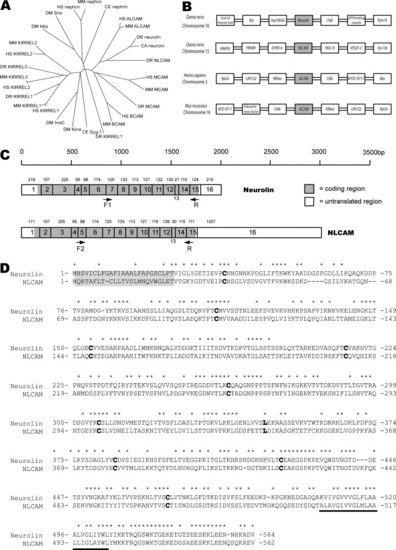
Family relationship, sequence and structural comparison of neurolin and NLCAM. (A) Phylogenetic tree of the ALCAM-group of proteins. The following families of proteins are identifiable: the ALCAM family, with the ALCAM- (including neurolin and NLCAM), BCAM- and MCAM-sub-families; the KIRREL-family; and the Nephrin-family. Duf/IrreC appear most closely related to KIRREL proteins. For species and gene abbreviations see Section 2. (B) The syntenic organisation of neurolin, NLCAM and ALCAM genes in zebrafish, human and mice, demonstrates partial duplication of the neurolin locus in vertebrates. (C) The predicted gene structure of neurolin and NLCAM mRNA is highly conserved suggesting a gene duplication. mRNAs shown approximately to scale. Exon size in base pairs (bp) is shown above each exon, and has been experimentally determined for all coding regions. The approximate location of probe PCR primers is shown. (D) The aligned protein sequences with identical residues marked with asterisk (*) above. The N-terminal signalling sequence (grey box) and transmembrane region (underlined) flank the cysteine (and solitary leucine) residues that define the Ig-like domains (bold). |
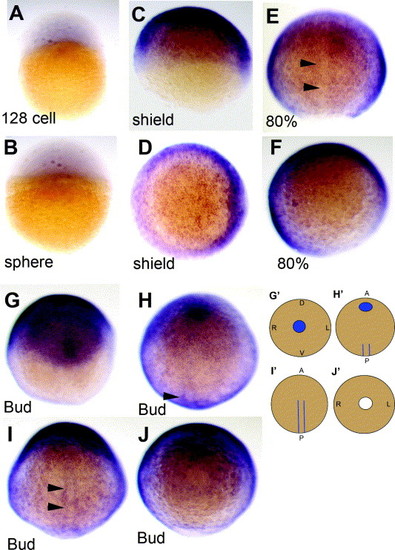
NLCAM mRNA is widespread during the gastrulation phase. (A and B). Low level signal in 128-cell and sphere stage, in lateral view. (C–F) Shield (C and D) and 80% epiboly (E and F) embryos in lateral (C), dorsal (E) and animal pole (D and F; shield to the right) view, showing widespread expression but reduction in the midline (arrowheads). (G–J) A single bud-stage embryo viewed in successive rostro-caudal ∼90 ° rotations: A (anterior); P (posterior); D (dorsal); V (ventral); L (left); R (right). Note the elliptical head region (G) and the posterior adaxial stripes (H and I, arrowheads). These are represented in cartoon form in (G′–J′). Blue indicates regions of higher signal compared to the gastrulating embryo and white, the blastopore. |
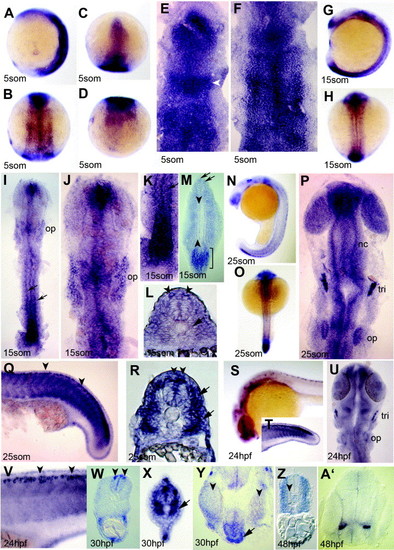
Expression of NLCAM during somitogenesis. (A–F) Basal expression throughout 5 som stage embryos with regions of distinction. Anterior head region expresses more highly, as does mid-hindbrain band (C and E; arrowhead). Irregular transverse zones of higher expression are evident in the neural plate (B and F), whereas the tailbud expresses weakly (A and D). Wholemounts in (A–D) and flatmounts in (E and F) anterior to top; (A) is lateral view; (B and F) dorsal views of midbody; (C and E) dorsal views of the head; (D) dorsal view of the tail. (G–L) 15 som stage embryos viewed from lateral (G), dorsal (H), dorsal flatmount (I–K) and cryosections (L and M). A single dorso-ventral disc of expression is seen in the nose region (G, I, J), as well as higher staining at the level of the mid-hind brain boundary and developing otic placodes (G, I, J; op). Expression is high in the forming neural plate (G, I, K, M), but declines anteriorly to bilateral rows (I, K, arrows). (M) An oblique section at 15 som stage shows a portion of the posteriormost neural plate with high expression (M, bracket) with dorsal restriction in more anterior neural plate (M, arrows). Weak expression in somites flanks a clear zone in notochord and adaxial cells (M, arrowheads indicate left-hand row). (L) Midtrunk 15 som section shows bilateral cells in the dorsal CNS (L, arrowheads) as well as a reduced signal in adaxial cells (L, arrow). (N–R) The posterior neural plate also expresses highly at 25 som (lateral (N and Q) and dorsal (O and P) wholemounts (N and O) and flatmounts (P and Q); R yolk extension section). Neural crest (nc), anterior nasal and retinal regions express in the head at 25 som (P). Staining from this stage is also seen in Rohon-Beard neurons (Q and R arrowheads) and near recently migrated slow muscle fibres (Q and R, arrows). (S–V) Lateral view of 24 hpf embryos (S, T, V) and dorsal flatmount of head (U) show large reduction in NLCAM signal. Staining is observed in the developing eye, Rohon–Beard neurons (V, W, arrowheads) and trigeminal placode (tri). (W, X) Sections of 30 hpf embryo through yolk extension (W) and tail (X) regions to show Rohon–Beard neurons in the dorsal neural tube (arrowheads) and in muscles cells adjacent to the notochord (X). (Y) An oblique 30 hpf head frontal section showing pituitary signal (arrow) ventral to hypothalamus between the eyes (arrowheads). (Z, A′) By 48 hpf, a lower magnification section of yolk extension somites shows exclusion of NLCAM mRNA around the notochord but continued low level expression in most muscle (Z, arrowhead). An anterior head section shows localised signal in the telencephalon (A′). EXPRESSION / LABELING:
|
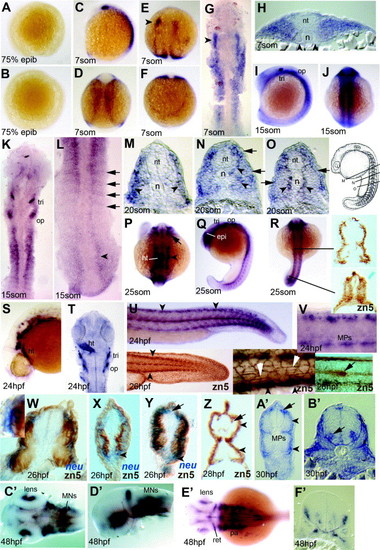
Expression of neurolin and zn-5 antigen in zebrafish embryos up to 48hpf. (A and B) Lateral (A) and animal pole (B) views of embryo at 75% epiboly with no detectable signal. (C–H) Expression at 7 som viewed in wholemount (C–F; C lateral, E dorsal head, D dorsal trunk, F dorsal tailbud), dorsal flatmount (G) and trunk cryosection (H). The lateral region of anterior somites expresses neurolin (G and H), but adaxial cells do not (H, arrowheads). Lateral neural tissue of the head expresses, showing a markedly greater expression on the left (E and G arrowheads). (I–L) Embryos at 15 som in lateral (I), dorsal (J–L) wholemount (I and J) and flatmount (K and L) view. In anterior somites, signal extends more broadly lateral (I and K) compared to the posterior somites, where positive cells form single layers corresponding to somite borders and are also present in neural plate (L, arrows and arrowhead, respectively). (M–O) Serial cryosections of a wholemount neurolin-stained 20 som stage embryo at positions indicated in the schematic (modified from Kimmel et al., 1995). Slow fibre signal is present before, during and after migration (O, N, M, respectively, arrowheads). Expression is also present in lateral somite cells (M–O, arrows). (P–R) Dorsal (P and R) and lateral (Q) view of 25 som stage. Head expression includes retina, neural crest and heart (P; arrow, arrowhead and ht, respectively). The same embryo shows staining in the epiphysis, trigeminal and otic placodes (Q; epi, tri, op) and lateral mesoderm (R). Cryostat sections of wholemount zn-5-stained 25 som embryo at the indicated levels reveal transient zn-5 antigen throughout the nascent somite, becoming restricted to superficial cells in anterior smites (R, right). (S–V) 24 hpf embryos shown in lateral wholemount view of head (S) and tail (U), with flatmounts of head shown dorsally (T, ht heart) and the tail laterally (V). Clusters of cells in dorsal neural tube and 3–4 MP cells per somite at the dorso-ventral midline are evident (V). The zn-5 antigen labels similar cells in wholemount 26 hpf embryos (U, insets) including the dorsal and ventral somite extremes (black arrowheads, left and middle inset), the muscle pioneers, the superficial slow fibres (white arrowheads, middle inset) and the lateral line primordium (arrow, right inset). Note the lack of zn-5 antigen in Rohon–Beard neurons and posterior neural tube and the more marked antigen in lateral cell junctions within the ectoderm compared to the neurolin mRNA level. (W–Z) Dual wholemount staining for neurolin mRNA (blue, W–Y) and zn-5 immunoreactivity (brown, W–Z). Neurolin mRNA is present superficial to zn-5 stain (W, box magnified in inset; X,Y arrowheads). At 26 hpf, fast muscle contains zn-5 but no detectable neurolin mRNA (W and Y), slow muscle reacts strongly for zn-5 but has little neurolin mRNA (W–Y). Neurolin mRNA is detectable in Rohon–Beard neurons without zn-5 signal (Y, arrow). By 28 hpf, Rohon–Beard neurons react for zn-5 (Z, arrow) but fast muscle has lost zn-5 antigen. (A′ and B′) Cryosections of 30 hpf embryos in anterior trunk show staining in MNs in the ventral neural tube (nt) (B′, arrow). In mid-trunk region (A′), signal is in the dorsal and ventral superficial somite, muscle pioneer slow fibres and Rohon–Beard neurons (A′, arrowheads, MP and arrow, respectively). (C′–F′) Complex expression of neurolin in head and eye of 48 hpf embryos shown in dorsal (C′ and E′) and lateral view (D2) following dissection of head. Cryosection through the head at the region of ear (F2) shows small clusters of expressing cells, probably including cranial MNs of the ventral neural tube, neural entry/exit points and placodal cells. Abbreviations: epi, epiphysis; ht, heart; MPs, muscle-pioneer slow cells; op, otic placode; pa, pharyngeal arches; ret, retina; tri, trigeminal placode. EXPRESSION / LABELING:
|
Reprinted from Gene expression patterns : GEP, 6(8), Mann, C.J., Hinits, Y., and Hughes, S.M., Comparison of neurolin (ALCAM) and neurolin-like cell adhesion molecule (NLCAM) expression in zebrafish, 952-963, Copyright (2006) with permission from Elsevier. Full text @ Gene Expr. Patterns