
- Title
-
Cadherin2 (N-cadherin) plays an essential role in zebrafish cardiovascular development
- Authors
- Bagatto, B., Francl, J., Liu, B., and Liu, Q.
- Source
- Full text @ BMC Dev. Biol.

Cadherin2 expression in developing zebrafish heart. Anterior is to the left and dorsal is up for panels A-H. Panels A-C are lateral views of the head region of whole mount zebrafish embryos labeled by in situ hybridization with cadherin-2 cRNA. The arrow points to the heart. Panels D and E are lateral views of higher magnifications of the heart. Panel F is a parasagittal section of a heart processed for whole mount in situ hybridization. Panels G and H are parasagittal sections of the ventricle processed for cadherin-2 (Cdh2) and Zn-5 immunocytochemical staining, respectively, both showing that the staining is confined mainly to cell membranes of myocardiocytes. Panels I and J show the same cross section of the ventricle (dorsal up) double-labeled with cadherin-2 antibody (panel I) and Zn-5 antibody (panel J). The arrows and arrowheads point to the same cells respectively. Abbreviations: a, atrium; ba, bulbus arteriosus; c, cerebellum; di, diencephalon; ec, endothelium; h, hindbrain; mc, myocardium; ot, optic tectum; v, ventricle. EXPRESSION / LABELING:
|

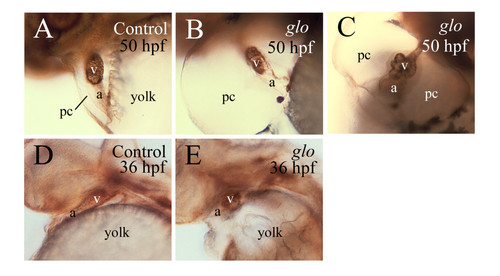
Enlarged pericardial cavity in glo mutant. Compared to a control embryo (panel A), the pericardial cavity (pc) is much enlarged in a cadherin2 morphant (panel B) and a glo mutant embryo (panels C and D). All panels are images from live embryos showing lateral views (anterior to the left and dorsal up) of the pericardial cavity and heart. Panel D is a higher magnification of the pericardial cavity showing in panel C. |
Gross cardiac morphological defects in glo mutant embryos revealed by Zn-5 immunostaining. All panels show lateral views of the heart of whole mount embryos labeled with the Zn-5 antibody. Anterior is to the left and dorsal is up. Abbreviations are the same as in Figure 1. |

Expression of cardiac specific genes in control (left column) and glo mutant hearts (right column). Panels A-D, G and H are ventral views of whole mount hearts with dorsal up. Panels E and F are lateral views of whole mount hearts with anterior to the left and dorsal up. Abbreviation: tm, trunk muscles. Other abbreviations are the same as in Figure 1. EXPRESSION / LABELING:
|
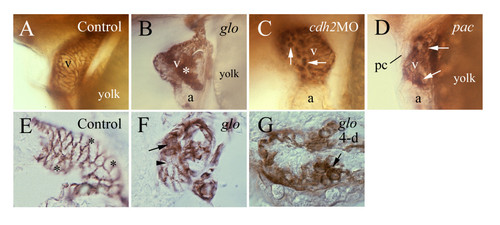
Zn-5 immunostaining reveals myocardiocyte defectsin a cadherin2 morphant, a pac mutant embryo and glo mutant embryos. Zn-5 immunostaining reveals myocardiocyte defects in a cadherin2 morphant (panel C), a pac mutant embryo (panel D) and glo mutant embryos (panels B, F and G). All embryos, except panel G (4-day old) are 48–50 hpf. Panels A-D are lateral views of whole mount hearts with anterior to the left and dorsal up. Panels E-G are sections of zebrafish hearts processed for whole mount Zn-5 immunostaining. The asterisk in panel B indicates a large cluster of myocardiocytes with Zn-5 immunoreactivity detected in both their cell membranes and cytoplasm. Arrows in panels C and D point to round shaped myocardiocytes with staining in the cell membrane and cytoplasm. Panel E is a parasagittal section (anterior to the left lower corner and dorsal to the left upper corner) of a control heart. Asterisks in this panel indicate regions that are out of focus. Panel F is a parasagittal section of a glo mutant heart (anterior to the left and dorsal up). Panel G is a parasagittal section (anterior to the left and dorsal up) of 4-day old glo mutant heart. Arrows in panels F and G point to round shaped myocardiocytes with labeling in their cell membranes and cytoplasm, while the arrowhead in panel F indicates a myocardial cell with weak labeling on its cell membrane. |
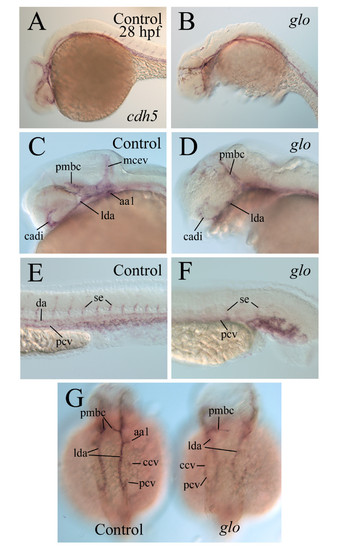
Development of the vasculature system in 28 hpfcontrol and glo mutant embryos as revealed by cdh5 staining. Development of the vasculature system in 28 hpf control (panels on the left column and the embryo on the left in panel G) and glo mutant embryos (the remaining panels) as revealed by cdh5 staining. Panels A-F show lateral views of whole mount embryos (anterior to the left and dorsal up). Panels C and D are higher magnifications of the head region, while panels E and F are higher magnifications of the trunk and tail regions. Panel G shows dorsal views of the embryo with anterior to the top. Abbreviations: aa1, mandibular arch; cadi, caudal division of the internal carotid artery; ccv, common cardinal vein; da, dorsal aorta; lda, lateral dorsal aorta; mcev, middle cerebral vein; pcv, posterior cardinal vein; pmbc, primordial midbrain channel; se, intersegmental vessel. EXPRESSION / LABELING:
|

cdh5 staining and FITC-dextran labeling of the developing vasculature system in 50 hpf whole mount embryos. (see Abbreviations) Panels A-D and E-H show cdh5 staining and FITC-dextran labeling, respectively, of the developing vasculature system in 50 hpf whole mount embryos (anterior to the left and dorsal up for all panels). Panels in the left column are from control embryos, while panels in the right column are from glo mutant embryos. Panels A, B, E and F are lateral views of the head region, while the remaining panels (higher magnifications) show lateral views of the trunk and/or tail regions. The head, trunk and tail of the mutant embryos are outlined by the dashed lines. EXPRESSION / LABELING:
|