
- Title
-
Separate Na,K-ATPase genes are required for otolith formation and semicircular canal development in zebrafish
- Authors
- Blasiole, B., Canfield, V.A., Vollrath, M.A., Huss, D., Mohideen, M.A., Dickman, J.D., Cheng, K.C., Fekete, D.M., and Levenson, R.
- Source
- Full text @ Dev. Biol.

Na,K-ATPase α1a.1 MOs block otolith formation. (A) Effect of antisense morpholinos on α1a.1 mRNA translation. α1a.1 mRNA was translated in vitro using a rabbit reticulocyte lysate system in the presence of 4 μM antisense MOs. [35S]-methionine-labeled in vitro translation products were analyzed on a 10% SDS-polyacrylamide gel (lower panel). Molecular weight marker is shown at the left. Intensity of the bands relative to control was quantified by densitometry (upper panel). (B-E) Morphants were injected with 0.25 ng of α1a.1 MO-1. Lateral view with anterior to the left. (B) Otic vesicle (OV) of wild type (WT) embryo at 45 hpf. (C) OV of α1a.1 morphant at 45 hpf. (D) WT embryo at 45 hpf. (E) α1a.1 morphant at 45 hpf. Arrowheads indicate otoliths. Arrow indicates midbrain-hindbrain boundary. mo, morphant. Scale bars: A-B, 50 μM; C-D, 250 μM. |

mRNA rescue of α1a.1 morphant. Coinjection of 125 pg of α1a.1 rescue mRNA and 0.25 ng of α1a.1 MO-1 into one-cell stage embryos. All panels show a lateral view with anterior to the left. (A) α1a.1 morphant at 36 hpf injected with 0.25 ng of α1a.1 MO-1 alone. Inset is an enlarged view of the otic vesicle (OV) lacking otoliths. (B) Fluorescent image of panel A confirming presence of FITC-labeled morpholino in embryos. (C) 36 hpf embryo coinjected with α1a.1 MO-1 (0.25 ng MO-1) and α1a.1 rescue mRNA (125 pg). Inset is an enlarged view of the OV containing two otoliths. Arrowheads indicate otoliths. (D) Fluorescent image of panel C. (E) Effect of MOs on translation of α1a.1 rescue mRNA. The region adjacent to the initiating ATG of α1a.1 rescue mRNA was engineered to contain a minimal Kozak consensus sequence so as not to match the targeting MO. The α1a.1 rescue mRNA was translated in the presence of 4 μM antisense MOs and analyzed as described in Fig. 1A. |
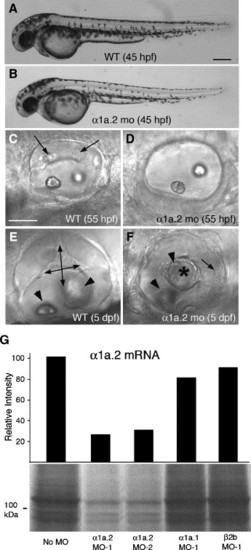
Knockdown of Na,K-ATPase α1a.2 mRNA disrupts development of semicircular canals. All panels show a lateral view with anterior to the left. Morphants were injected with 2 ng of α1a.2 MO-1. (A) Wild type (WT) embryo at 45 hpf. (B) α1a.2 morphant at 45 hpf. (C) Otic vesicle (OV) of WT embryo at 55 hpf. Arrows indicate protrusions of semicircular canals. (D) OV of α1a.2 morphant at 55 hpf. (E) OV of WT embryo at 5 dpf. Double-headed arrows show hubs of the semicircular canals. Arrowheads indicate otoliths. (F) OV of α1a.2 morphant at 5 dpf. Asterisk shows epithelial mass in center of OV. Arrowheads indicate otoliths. Arrow indicates the posterior crista. (G) Effect of MOs on translation of α1a.2 mRNA. α1a.2 mRNA was translated in the presence of antisense MOs (4 μM) and analyzed as described in Fig. 1A. mo, morphant. Scale bars: A–B, 250 μM; C–F, 50 μM. |

Expression of semicircular canal markers in α1a.2 morphant ears. All panels are lateral views with anterior to the left. Embryos were injected with 2 ng of α1a.2 MO-1 at the one-cell stage. (A–D) ncs-1a staining in the otic vesicle (OV) of (A) 48 hpf wild type (WT) embryo, (B) 48 hpf morphant, (C) 72 hpf WT embryo, and (D) 72 hpf morphant. (E–H) dfna5 staining in OV of (E) 48 hpf WT embryo, (F) 48 hpf morphant, (G) 72 hpf WT embryo, and (H) 72 hpf morphant. (I–L) ugdh staining in OV of (I) 48 hpf WT embryo, (J) 48 hpf morphant, (K) 72 hpf WT embryo, and (L) 72 hpf morphant. mo, morphant. Scale bar: 25 μm. EXPRESSION / LABELING:
|

Knockdown of Na,K-ATPase β2b expression. All panels show a lateral view with anterior to the left. (A) Wild type (WT) embryo at 45 hpf. (B) Embryo injected with 6 ng of β2b MO-1 at 45 hpf. (C) Otic vesicle (OV) of WT embryo at 45 hpf. (D) OV of embryo injected with 6 ng of β2b MO-1 at 45 hpf. Arrowhead indicates ectopic otolith. (E) OV of embryo injected with 0.125 ng of α1a.1 MO-1 at 45 hpf. mo, morphant. Scale bars: A–B, 250 μm; C–H, 50 μm. |
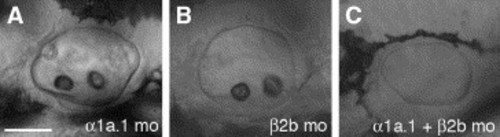
Coinjection of Na,K-ATPase α1a.1 and β2b MOs. Embryos were injected with sub-effective doses of α1a.1 and β2b MOs. Lateral views of otic vesicle (OV) at 45 hpf, anterior to the left. (A) OV of embryo injected with 0.125 ng of α1a.1 MO-1. No effect on otolith formation was observed. (B) OV of embryo injected with 2 ng of β2b MO-1 showing normal otolith formation. (C) Embryo co-injected with 0.125 ng of α1a.1 MO-1 and 2 ng of β2b MO-1 failed to form otoliths. mo, morphant. Scale bar: A–C, 50 μm. |

Tether cells are present in α1a.1 morphant ears. Immunofluorescence was used to detect tether cell somae by labeling with HCS-1 (red) and tether kinocilia by labeling with anti-acetylated tubulin (green). (A) Lateral view of 24 hpf wild type (WT) otocyst. A pair of tether cells, each with a single kinocilium, is present at the anterior and posterior pole. (B) Dorsal view of α1a.1 morphant at 24 hpf. Two pairs of tether cells with kinocilia are visible. The tether cell pairs are closer together than in WT embryos due to the smaller size of the morphant otocyst. (C) Confocal image of α1a.1 morphant at 28 hpf. A pair of tether cells with kinocilia are located at the anterior pole of the otocyst. mo, morphant. |
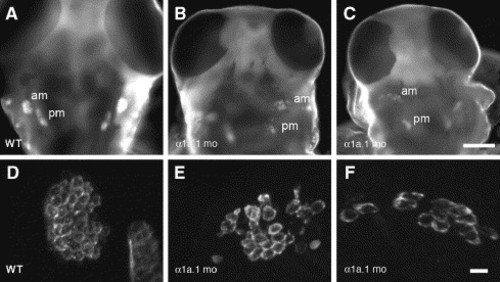
Macular sensory organs develop in α1a.1 morphants. Hair cells were labeled with HCS-1 antibody in wild type (WT) and α1a.1 morphant embryos at 75 hpf to visualize the anterior (am) and posterior (pm) maculae. (A–C) Low power images of embryos, dorsal views. Scale bar: 100 μm. (D–F) High power views of embryos showing labeled anterior maculae. Scale bar: 10 μm. (A, D) WT embryo. (B, C, E, F) α1a.1 morphants. Both pairs of maculae are present, but they have fewer hair cells and are less tightly clustered than WT. mo, morphant. |

Histological analysis of α1a.1 and β2b morphant ears. (A–H) 72 hpf wild type (WT) and morphant embryos were fixed, embedded in resin, sectioned at 1 μm, and stained with Toluidine blue. (A, C, E, and G) Sections through the anterior macula. (B, D, F, and H) Sections through posterior macula. Embryos injected with 0.25 ng of α1a.1 MO-1 are shown in panels C and D. Embryos injected with 6 ng of β2b MO-1 are shown in panels E and F, while embryos coinjected with 0.125 ng of α1a.1 MO-1 and 2 ng of β2b MO-1 are shown in panels G and H. hc, hair cell; sc, supporting cell. (I and J) Scanning electron micrographs of posterior macular otolithic membrane of WT embryo (I) and α1a.1 morphant (J) (injected with 0.25 ng α1a.1 MO-1) at 72 hpf. Arrows indicate hair cell ciliary bundles. Asterisk indicates otolith. Scale bars: 10 μm. |
Reprinted from Developmental Biology, 294(1), Blasiole, B., Canfield, V.A., Vollrath, M.A., Huss, D., Mohideen, M.A., Dickman, J.D., Cheng, K.C., Fekete, D.M., and Levenson, R., Separate Na,K-ATPase genes are required for otolith formation and semicircular canal development in zebrafish, 148-160, Copyright (2006) with permission from Elsevier. Full text @ Dev. Biol.