
- Title
-
Rab11-FIP4 is predominantly expressed in neural tissues and involved in proliferation as well as in differentiation during zebrafish retinal development
- Authors
- Muto, A., Arai, K.I., and Watanabe, S.
- Source
- Full text @ Dev. Biol.
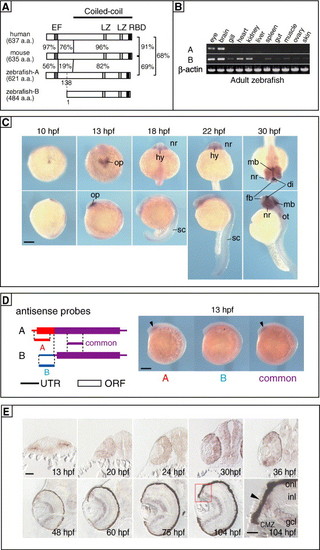
Cloning and characterization of zebrafish Rab11-FIP4. (A) Schematic representation of protein structures of Rab11-FIP4 orthologues. The numbers indicate percentages of identical amino acids between any 2 proteins. Conserved motifs are indicated as boxes. EF, EF-hand; LZ, leucine-zipper-like motif; RBD, Rab11-binding domain. The predicted coiled-coil region is indicated at the top. A putative zRab11-FIP4B protein was predicted from its nucleotide sequence to be translated from Met138 of the A-form. (B) Expression of zRab11-FIP4 isoforms in various tissues of adult zebrafish was examined by semi-quantitative RT-PCR. β-actin was used as a control. (C) Expression of zRab11-FIP4 in developing zebrafish embryos. Whole-mount in situ hybridization was performed by using RNA prepared from full-length cDNA of zRab11-FIP4A as a probe. di, diencephalon; fb, forebrain; hy, hypothalamus; mb, midbrain; nr, neural retina; op, optic vesicle; ot, otic vesicle; sc, spinal cord. Scale bar indicates 200 μm. (D) Expression of A and B isoforms of zRab11-FIP4. Positions of antisense probes specific for each transcript (A and B) and common for both (common) along cDNAs are illustrated (left). The length of each probe was about 300 bases. In situ hybridization was performed by using 13-hpf embryos (right). Expression in the optic pit was pointed by arrowhead. (E) Expression of zRab11-FIP4 in the developing retina. In situ hybridization of transverse sections of embryonic heads was performed by using the same probe described above. The boxed area around the CMZ (104 hpf) is shown at higher magnification in the lower right most panel. Arrowhead indicates zRab11-FIP4 expressed in the CMZ. CMZ, ciliary marginal zone; gcl, retinal ganglion cell layer; inl, inner nuclear layer; onl, outer nuclear layer. Scale bars indicate 50 μm except in the lower right most panel, where the scale bar indicates 20 μm. |

Small eye and head phenotype in zRab11-FIP4-depleted embryos. (A) Schematic representation of the structure of zRab11-FIP4A-EGFP fusion gene and corresponding positions of the zRab11-FIP4A-specific MOs. Colored bars and solid lines indicate ORFs and untranslated regions, respectively. (B) Evaluation of the effect of the zRab11-FIP4A-specific MOs. Embryos were injected with in vitro synthesized zRab11-FIP4A-EGFP RNA along with control-MO, zRab11-FIP4-MO1 or MO2. Morphology (upper) and EGFP expression (lower) at 18 hpf are shown in lateral views. (C) Morphology of control embryos (upper) and zRab11-FIP4 morphants (lower) observed at the indicated times is shown in lateral views. (D) Expression of retinal and brain markers in an early stage of MO-injected embryos. Control-MO- or zRab11-FIP4-MO1-injected embryos were fixed at 18 hpf and then subjected to whole-mount in situ hybridization. In all cases, expression of markers in zRab11-FIP4 morphants was comparable to that in control embryos. Scale bars indicate 200 μm. EXPRESSION / LABELING:
PHENOTYPE:
|
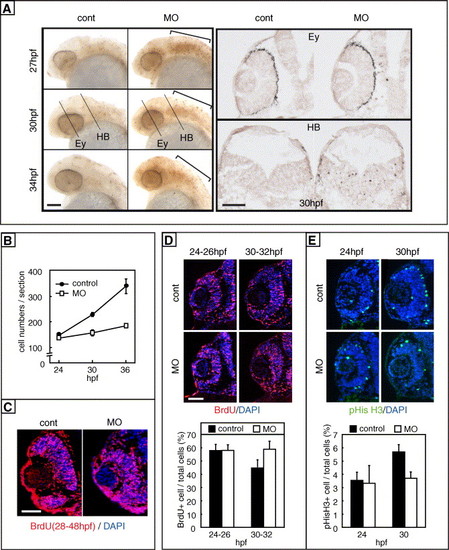
Impaired proliferation of retinal progenitors in zRab11-FIP4 morphants. (A) Cell death in the MO-injected embryos. Embryos injected with either control-MO (left column) or zRab11-FIP4-MO1 (right column) were subjected to the TUNEL assay using whole embryos (left panel) and tissue sections (right panel). (Left panel) Embryos fixed at 27, 30 and 34 hpf were analyzed. Excess cell death in the hindbrain region of the morphants is marked with brackets. (Right panel) Transverse sections prepared from control and the morphants at 30 hpf were analyzed. Sections at the levels of the eye (Ey) and hindbrain (HB) were used, and the positions are indicated in the left panel. (B) Increase in the retinal cell number during development as estimated by counting the cells in tissue sections. The cell number/retinal section at each time was calculated as the average of numbers scored from at least 17 (control, closed circles) or 23 (zRab11-FIP4 morphants, open squares) sections prepared from 4 to 5 embryos. Standard deviations are indicated as error bars. The differences are statistically significant at 30 and 36 hpf (P < 0.001 in each case) but not at 24 hpf (P > 0.1). (C) Proliferating cells in the retina were examined by a long-term incorporation of BrdU from 28 to 48 hpf. (D) Retinal cells in the S-phase were labeled by short-term (2 h) BrdU incorporation starting at either 24 or 30 hpf. (Upper panel) Transverse sections were immunostained with the anti-BrdU antibody. (Lower panel) The number of BrdU+ cells was counted, and the ratio to total cells was scored. Standard deviations are indicated as error bars. (E) Mitotic cells in the retina were immunostained with an anti-phospho-histone H3 antibody. (Upper panel) Immunostained mitotic cells in transverse sections are seen. (Lower panel) Ratios of mitotic cells (pHisH3+) to total cells in retinal sections of 24- and 30-hpf embryos were scored. In panels D and E, the differences between control and zRab11-FIP4 morphants are statistically significant at 30 hpf (BrdU; P = 0.01, pHisH3; P = 0.008) but not at 24 hpf (BrdU; P = 0.86, pHisH3; P = 0.75). Scale bars indicate 50 μm. |
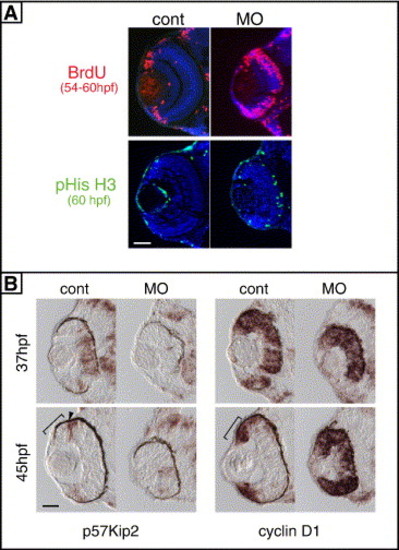
Cell-cycle exit of retinal progenitors was impaired in zRab11-FIP4 morphants. (A) Cells in cell cycle were analyzed by BrdU labeling (54 to 60 hpf) and immunostaining for pHisH3 (60 hpf). (B) The expression of cyclin D1 and p57kip2 in the retina was analyzed by in situ hybridization at 37 and 45 hpf. Expression of p57kip2 at the peripheral region of the control retina at 45 hpf are pointed out by an arrowhead. The position of CMZ is marked with a bracket. Scale bars indicate 50 μm. |
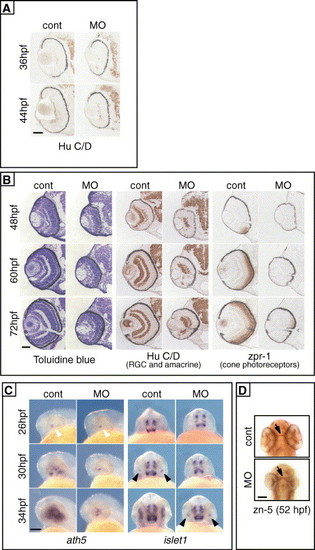
Retarded differentiation of retinal cells in zRab11-FIP4 morphants. (A) Differentiation of RGCs. Transverse sections prepared from control embryos and zRab11-FIP4 morphants at 36 hpf (upper photos) and 44 hpf (lower photos) were immunostained with anti-Hu C/D antibody. (B) Transverse sections prepared from control embryos or zRab11-FIP4 morphants at 48, 60 and 72 hpf were stained with toluidine blue to analyze the morphology (left panel), and others were used to examine the expression of differentiation markers (Hu C/D for RGC and amacrine [middle panel] and zpr-1 for cone photoreceptors [right panel]). Scale bar indicates 50 μm. (C) Expression of ath5 (lateral views, left panel) and islet-1 (ventral views, right panel) mRNAs was examined by whole-mount in situ hybridization. Control embryos and zRab11-FIP4 morphants fixed at 26, 30 and 34 hpf were analyzed. Initial expression of Ath5 (white arrowheads) and islet1 (black arrowheads) was observed in a small area of the ventronasal retina. (D) Whole-mount staining of RGC axons in control embryos and zRab11-FIP4 morphants with monoclonal antibody zn-5 at 52 hpf. Ventral views. Arrows point to the optic chiasm. Scale bars indicate 50 μm in panels A and B and 100 μm in panels C and D. |
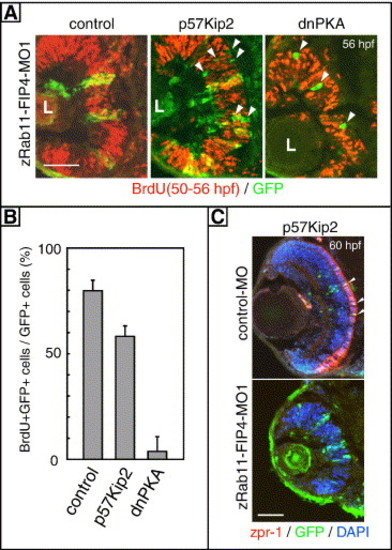
Co-expression of p57kip2 or dnPKA with zRab11-FIP4 morpholino. (A, B) The cell cycle was analyzed by BrdU incorporation. Zebrafish embryos were injected with zRab11-FIP4-MO1 in combination with a plasmid to express p57Kip2/EGFP, dnPKA-EGFP or EGFP alone (control) under the regulation of the heat shock promoter. These genes were induced by incubating at 39°C for 1 h (24 to 25 hpf), and proliferating retinal cells were then examined by labeling with BrdU for 6 h (50–56 hpf). Immunostaining patterns with anti-BrdU and GFP are shown in panel A, and GFP-positive cells that had exited from the cell cycle are indicated by arrowheads. L, lens. The ratio of BrdU/GFP double-positive cells to total GFP-positive cells is shown in panel B. The difference between the control and either p57Kip2 or dnPKA-expressing samples is statistically significant (P < 0.001 in each case). (C) A plasmid GFP:HSE:p57Kip2 was coinjected with zRab11-FIP4-MO1 or control-MO into 1- to 4-cell embryos. Differentiation of photoreceptors was examined by immunostaining with zpr-1 at 60 hpf. Zpr-1/GFP double-positive cells are pointed out by arrowheads. Scale bars indicate 50 μm. |
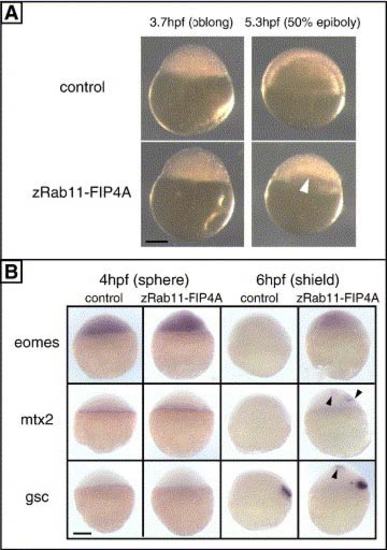
Supplementary Fig. 1. Functional analysis of zRab11-FIP4 by ectopic expression. (A) Morphology of early embryos injected with EGFP mRNA alone (upper) or in combination with mRNA for zRab11-FIP4A (lower) is shown. Three hundred picograms each of RNAs was injected. Animal pole is at the top. Morphological defects in the zRab11-FIP4A-expressing embryos were not observed at oblong stage (left, 3.7 hpf) but appeared after the onset of epiboly (right, 5.3 hpf) as an unequal distribution of deep cells (white arrowhead). Most of these embryos then underwent lysis between 8 and 12 hpf (see also Table 1). (B) Effect of ectopically expressed zRab11-FIP4A on gene expression. The expression of eomesodermin (eomes), mtx2 and goosecoid (gsc) before (4 hpf) and after (6 hpf) the appearance of the morphological phenotype. Positions of ectopically expressed of mtx2 and gsc are indicated by black arrowheads. The animal pole is at the top, and scale bar indicates 200 µm. |
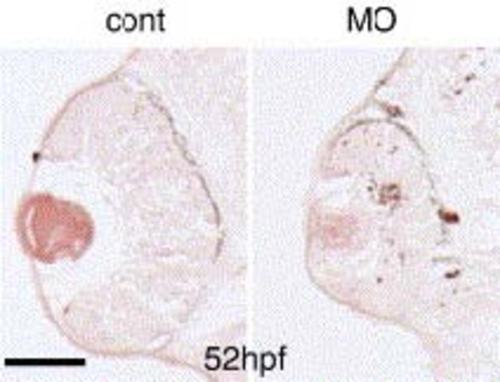
Cell death in the zRab11-FIP4 morphant retina. Control-MO or zRab11-FIP4-MO1-injected embryos were fixed at 52 hpf, and cell death in the retina was analyzed by the TUNEL assay using transverse sections. The number of TUNEL-positive cells was increased throughout the retina of the morphant. Scale bar indicates 50 µm. PHENOTYPE:
|
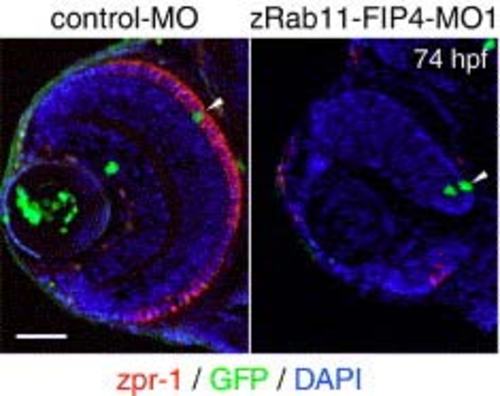
Impaired differentiation of dnPKA-expressing retinal cells into photoreceptors. pBS[hsp:dnPKA/EGFP] was coinjected with either control-MO or zRab11-FIP4-MO1, and then the expression of dnPKA/EGFP was induced by incubating at 39°C for 1 h from 24 hpf. The differentiation of photoreceptors was examined by immunostaining with zpr-1 (red) at 74 hpf. Arrowheads indicate the dnPKA/EGFP-expressing cells (green) located at ONL. Scale bar indicates 50 µm. |
Reprinted from Developmental Biology, 292(1), Muto, A., Arai, K.I., and Watanabe, S., Rab11-FIP4 is predominantly expressed in neural tissues and involved in proliferation as well as in differentiation during zebrafish retinal development, 90-102, Copyright (2006) with permission from Elsevier. Full text @ Dev. Biol.