
- Title
-
Cyclooxygenase-1-derived PGE2 promotes cell motility via the G-protein-coupled EP4 receptor during vertebrate gastrulation
- Authors
- Cha, Y.I., Kim, S.H., Sepich, D., Buchanan, F.G., Solnica-Krezel, L., and Dubois, R.N.
- Source
- Full text @ Genes & Dev.

cox1, ptges, and ep4 transcripts are expressed ubiquitously during gastrulation. (A–D) Lateral view, dorsal to the right. Expression of cox1 (A), cox2 (B), ptges (C), and ep4 (D) transcripts visualized by whole-mount in situ hybridization. (ant) Anterior. EXPRESSION / LABELING:
|
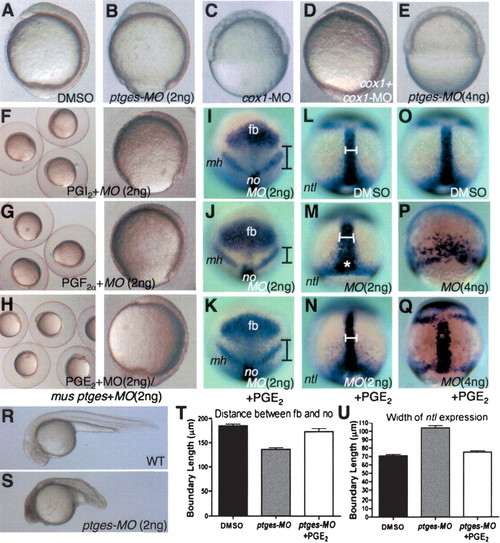
Ptges-deficient embryos exhibit gastrulation defects that are suppressed by coincubation with PGE2. (A-H) Lateral view, dorsal to the right. (I-K) Animal view, dorsal to the bottom. (L-Q) Dorsal view, anterior to the top. (R,S) Lateral view, anterior to the left. (I-K) Boundaries indicate the distance from the posterior end of the forebrain to the anterior end of the notochord. (L-Q) Boundaries indicate the width of the notochord. (A,I,L,O) Control embryos treated with DMSO. (B,F-H,J,K,M,N,S) Embryos injected with 2 ng of ptges-MO2. (E,P,Q) Embryos injected with 4 ng of ptges-MO2. (C,D) Embryos injected with 10 ng of cox1-MO. (D) Embryos coinjected with cox1-MO (10 ng) and cox1 RNA (50 pg). (F) Embryos injected with 2 ng of ptges-MO2 + PGI2. (G) Embryos injected with 2 ng of ptges-MO2 + PGF2α. (H,K,N) Embryos injected with 2 ng of ptges-MO2 + PGE2. (Q) Embryos injected with 4 ng of ptges-MO2 + PGE2. (H) Embryos coinjected with ptges-MO2 (2 ng) + mouse ptges RNA (100 pg). (I-K) Expression patterns of six3b, pax2.1. (L-Q) Expression pattern of no tail. (T) Quantitative analyses of the distance between the forebrain (fb) and notochord (no) in DMSO, ptges-MO2, and ptges-MO2 + PGE2 (n = 10 per each group). (U) Quantitative analyses of width of ntl expression in DMSO, ptges-MO2, and ptges-MO2 + PGE2 (n = 10 per each group). (fb) Forebrain; (mh) mid-hindbrain; (no) notochord. The white star marks the blastopore to illustrate delayed epiboly. For details see text. |
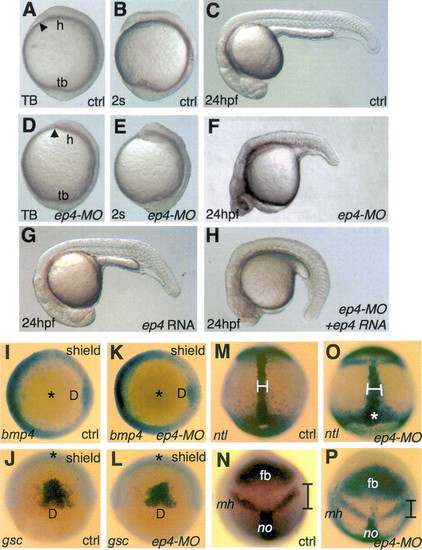
EP4-deficient embryos exhibit convergence and extension defect during gastrulation. (A,B,D,E) Lateral view, dorsal to the right. (C,F,G,H) Lateral view, anterior to the left. (I,K) Animal view, dorsal to the right. (J,L) Dorsal view, animal pole to the top. (M,O) Dorsal view, anterior to the top. (N,P) Anterior view, dorsal to the bottom. (M,N) Boundaries indicate the width of the notochord. (N,P) Boundaries indicate the distance from the posterior end of the forebrain to the anterior end of the notochord. (A-C,I,J,M,N) Uninjected control. (D-F,H,K,L,O,P) ep4-MO2 (2 ng) injected embryos. (G,H) ep4 RNA (80 pg) injected embryos. (H) Embryos injected with ep4-MO2 (2 ng) + ep4 RNA (80 pg). (I,K) bmp4 expressions. (J,L) gsc expressions. (M,O) no tail (ntl) expressions. (N,P) six3, pax2, and ntl expressions. (h) Head; (tb) tailbud; (D) dorsal; (fb) forebrain; (mh) mid-hindbrain; (no) notochord. The arrowhead points to the location of the prechordal plate at the tailbud stage. The white star highlights the blastopore to illustrate delayed epiboly. The black star indicates the animal pole. |

EP4-deficient embryos exhibit decreased cell motility in dorsal migration, while maintaining normal cell shape. (A) Domains of convergence and extension movements in zebrafish gastrulae (Myers et al. 2002. Orange arrows indicate domains of slow convergence and extension. (B) A diagram to demonstrate the difference between total versus net speed. (C) A schematic representation of the method used to measure cell shape. (LWR) Length-to-width ratio. (D–F) Cell behavior of mesoderm cells during slow convergence toward the dorsal midline. (D) Total and net dorsal speed of lateral mesodermal cells at 80% epiboly. (E) Meandering index of lateral mesodermal cells. The meandering index was determined by dividing the total speed by the net speed. (F) LWR of lateral mesodermal cells. Lateral mesoderm measurements were made in wild-type (two embryos, 84 cells), control EP4-MO-injected (EP4-MOc; two embryos, 80 cells), and EP4-deficient (six embryos, 224 cells) embryos. |

PI3K/Akt is activated downstream of EP4 signaling. (A-C) Lateral view, dorsal to the right. (B) Ten micromolar PI3K/Akt inhibitor, LY294002. (C) Thirty micromolar PI3K/Akt inhibitor, LY294002. (D) Uninjected, ep4-MO2 (2 ng), or ptges-MO2 (2 ng) injected. (E) Uninjected, ep4-MO2 (2 ng), or ep2-MO2 (2 ng) injected. (F) Uninjected or ep4-MO2-injected (2 ng) embryos treated with or without exogenous PGE2 (5 μ). (G) Uninjected, ep4-MO2 (2 ng), or ep2-MO (2 ng) injected embryos. (H) Molecular mechanisms for PGE2 signaling in vertebrate gastrulation. Lysates from 2.5 embryos were loaded into each well for Western blot analyses. (pAKT) Phosphorylated AKT; (AKT) total AKT; (pERK) phosphorylated ERK; (ERK) total ERK. Please see text and Materials and Methods for details. |

ZFIN is incorporating published figure images and captions as part of an ongoing project. Figures from some publications have not yet been curated, or are not available for display because of copyright restrictions. PHENOTYPE:
|
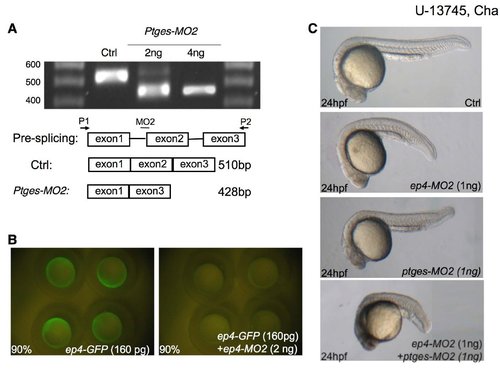
Morpholinos against ptges and ep4 transcripts are effective and demonstrate synergism. (A) RT-PCR analyses of ptges transcripts from total RNA isolated from 15 embryos in uninjected control (ctrl), 2ng of ptges-MO2 injected, and 4ng of ptges-MO2 injected embryos. Diagram demonstrates the loss of exon2 in ptges-MO2 injected embryos due to blocking of splicing acceptor site. This results in alternative splicing from the splicing donor site at the end of exon1 and acceptor site in the beginning of exon3. This was verified by sequencing of the 428bp band. (B) Images of embryos overexpressing GFP-tagged EP4 receptor injected with ep4-gfp RNA alone or co-injected with ep4-MO2. (C) ep4- and ptges-MO reveal synergism at sub-optimal doses. Injection of ep4- or ptges-MO at 1ng cause mild shortening of zebrafish length at 24 hpf. However co-injection of ep4- and ptges-MO at 1ng results in synergistic effect on the length of zebrafish embryos at 24 hpf. EXPRESSION / LABELING:
|
|
Unillustrated author statements EXPRESSION / LABELING:
PHENOTYPE:
|