
- Title
-
Inhibition of zebrafish fin regeneration using in vivo electroporation of morpholinos against fgfr1 and msxb
- Authors
- Thummel, R., Bai, S., Sarras, M.P. Jr, Song, P., McDermott, J., Brewer, J., Perry, M., Zhang, X., Hyde, D.R., and Godwin, A.R.
- Source
- Full text @ Dev. Dyn.

Injection and in vivo electroporation of standard control morpholino. A: Bright-field image of injected and electroporated fin at 24 hpa. B: Fluorescence image of the same injected and electroporated fin at 24 hpa. C: Confocal Z-stack of a region of an electroporated fin at 24 hpa showing fluorescence in both the underlying mesenchyme and overlying wound epidermis (arrows). The dotted line denotes the boundary between the dorsal (D) and ventral (V) sides of the fin. D: Confocal Z-stack of a magnified region, proximal to the epidermis and distal to the end of a bony ray, of the dorsal side of the fin shown in C. E: Graph comparing areas of outgrowth of dorsal (experimental) and ventral (control) sides at 72 hpa. At least five fins were examined for each concentration of morpholino. *, injected dorsal side of the fin; arrowheads, plane of amputation; D, dorsal side; V, ventral side. Scale bar (red) in C = 200 μm and in D = 50 μm. |
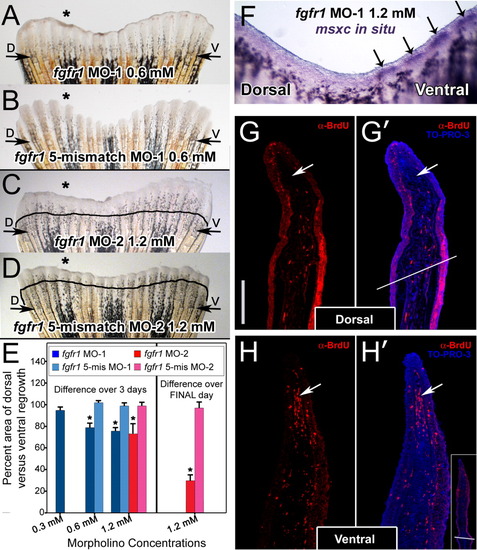
Injection and in vivo electroporation of fgfr1 morpholinos. A: Fin electroporated with 0.6 mM fgfr1 morpholino (fgfr1 MO-1). B: Fin electroporated with 0.6 mM of the corresponding fgfr1 5-mismatch morpholino. C: Fin electroporated with 1.2 mM of a second fgfr1 morpholino (fgfr1 MO-2). D: Fin electroporated with 1.2 mM of the corresponding fgfr1 5-mismatch morpholino. E: Graph comparing areas of outgrowth of dorsal (experimental) and ventral (control) sides at 72 hpa. On the left, bars depict the percent area of dorsal versus ventral re-growth as calculated over the entire 72 hpa. On the right is the second 1.2 mM experiment for which percent inhibition only over the final 24 hr of outgrowth was calculated. The asterisks in E denote a significant difference in outgrowth compared to fins injected with the corresponding concentration of the appropriate 5-mismatch control morpholino (P less than or equal to 0.005). At least five fins were examined for each concentration of morpholino. F: Wholemount RNA in situ hybridization of a fin electroporated with 1.2 mM of fgfr1 morpholino exhibiting an absence of msxc expression only on the dorsal (experimental) side of the fin. Arrows point to msxc expression in the blastemas of the ventral (control) side of the fin. G, G′, H, H′: Representative sections of dorsal (G, G′) and ventral (H, H′) blastemas from a 1.2-mM fgfr1 morphant fin demonstrating reduced BrdU incorporation (red cells) in dorsal blastemas. G′ and H′ have been co-labeled with TO-PRO-3 (blue), a nuclear stain. White arrows point to the blastema. Note the presence of a fewer number of positive cells in this region in the dorsal (experimental) side of the fin shown in G and G′ compared to the ventral (control) side of the fin shown in H and H′. In G′, the white line bisecting the section marks the cut site. Similarly, the inset in H′ shows a lower magnification image of the fin in H′ demonstrating the cut site. The vertical scale bar in G, representative for G - H′, is 150 μm. EXPRESSION / LABELING:
|

Injection and in vivo electroporation of msxb morpholinos. A: Fin electroporated with 1.2 mM msxb morpholino. B: Fin electroporated with 1.2 mM msxb 5-mismatch morpholino. C: Fin electroporated with 1.2 mM (0.6 mM of each) msxb splice morpholinos. D: Whole mount in situ hybridization using msxc probe of fin electroporated with 1.2 mM msxb morpholino. Note the equal distribution of msxc expression across the fin. Black line, distal edge of fin re-growth at the time of fin injection/electroporation. For A-D, the dorsal (experimental) side is shown on the left and denoted by an asterisk. In each case, the ventral side of the fin was also electroporated, but it was not injected with a morpholino. E: Graph comparing areas of outgrowth of dorsal (experimental) and ventral (control) sides at 72 hpa. On the left, bars depict the percent inhibition as calculated over the entire 72 hpa. On the right is the second 1.2-mM experiment for which percent inhibition only over the final 24 hr of outgrowth was calculated. *Significant difference in outgrowth compared to fins injected with the corresponding concentration of the appropriate 5-mismatch control morpholino (P less than or equal to 0.001). At least five fins were examined for each concentration of morpholino. F: RT-PCR analysis of altered msxb transcript splicing by the pair of msxb splice morpholinos. Top: RT-PCR analysis on embryos injected with both msxb splice morpholinos. Bottom: RT-PCR analysis on fins injected/electroporated with 1.2 mM of the msxb splice morpholinos. For both panels, the PCR conditions were the same. The primers used are listed above the lanes at top, with their approximate binding location to msxb depicted in a cartoon below the bottom panel. G: PCNA-immunolocalization in fins injected/electroporated with 1.2-mM msxb morpholino. On the left, representative images of PCNA-immunostaining in longitudinal sections from dorsal (experimental) and ventral (control) halves of the fin. White bars that transverse the low-magnification images depict the cut site. Scale bar = 50 μm. On the right is a graph depicting the average number of PCNA-positive cells in the distal 150 μm of the dorsal and ventral blastemas. *Significant difference (P < 0.0001) between the dorsal (experimental) and ventral (control) halves of the fin. EXPRESSION / LABELING:
|