
- Title
-
Zebrafish id2 developmental expression pattern contains evolutionary conserved and species-specific characteristics
- Authors
- Chong, S.W., Nguyen, T.T., Chu, L.T., Jiang, Y.J., Korzh, V.
- Source
- Full text @ Dev. Dyn.

Comparison of the zebrafish (Danio rerio) Id2 with that of other organisms shows evolutionary conservation of this protein. A: The predicted amino acid sequences of the zebrafish id2 gene (accession no. DQ186992) aligned with those of rainbow trout, Xenopus, chicken, mouse, and human. Yellow-boxed letters indicate conserved amino acids. Blue outlined text highlights the conserved cyclinE/A-CDK2 phosphorylation site SPVR. Two helix regions indicated by red outline and loop region highlighted by green outline, together make up the helix-loop-helix region. B: Phylogenetic analysis (Clustal Method) shows that zebrafish Id2 is correctly placed in the second subclass under the Id family. Refer to the Experimental Procedures section for the GenBank accession numbers of the other Id genes. C: Reverse transcriptase polymerase chain reaction (RT-PCR) detects the continuous presence of transcripts of id2 during early development. RT-PCR was performed using id2-specific primers. The embryonic stages are indicated on top of each lane. id2 is present at high levels before mid-blastula transition (MBT). To confirm the early maternal expression, bands were cut out from the agarose gel and sequenced. EF1α was used as a positive control. RT-negative controls were carried out at the same time and no band was detected (data not shown). EXPRESSION / LABELING:
|
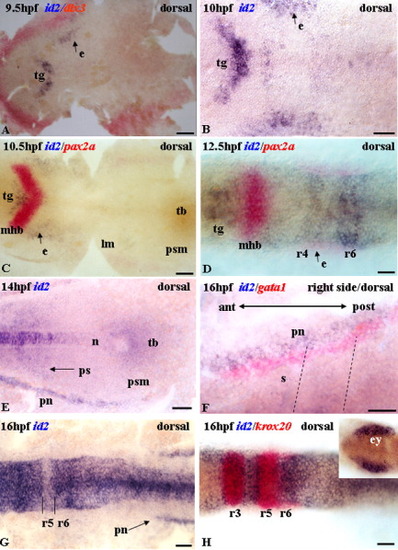
Expression of id2 during early developmental stages. All images are of flat-mounted embryos in dorsal view. A: id2 expression in the tegmentum and ear primordium. Double staining with dlx3(red), which demarcates the periphery of the embryo. B: Transcripts in the tegmentum, ear primordium, and hindbrain. C: Double staining with pax2a(red), which stains the midbrain-hindbrain boundary and confirms location of tegmentum. D: Two distinct cell clusters in the midbrain and rhombomere 6 express id2. Locality of these two clusters is confirm by double staining of id2(blue) and pax2a(red). E: Expression in the notochord, stripes of mesodermal cells at the lateral edge, presomites, and tail bud. F: Magnified right side view. Double staining with gata1(red), which stains the hematopoietic cells. Somites express id2 weakly. Black dashed lines demarcate somite boundaries. G: Expression in the hindbrain except rhombomere 5. Stripes of lateral mesoderm express id2. H: The gap in rhombomere 5 is confirmed by double staining of id2(blue) and krox-20(red). Inset, low magnification of this embryo. Expression in the eye primordium. ant, anterior; e, ear; ey, eye primordium; lm, lateral mesoderm; mhb, midbrain-hindbrain boundary; n, notochord; pn, pronephros; post, posterior; ps, presomites; psm, presomitic mesoderm; r, rhombomere; s, somite; tb, tail bud; tg, tegmentum. Scale bars = 50 μm. EXPRESSION / LABELING:
|

Expression of id2 at the end of the first day of development. A,C,D: Dorsal views; B,E,F: lateral views; G,H: cross-sections. A: Transcripts in the hypothalamus, dorsal retina, trigeminal ganglia, hindbrain, and ear. B: Eyes dissected out to demonstrate id2 transcripts in the hypothalamus. C,D: Dorsal layer in the neural tube expresses id2. E: Black broken lines indicate somite boundaries and id2 riboprobe stains the characteristic migratory neural crest cells in the trunk. This finding is also indicated by black arrows in G,H. The lateral stripe of id2 expressing cells in Figure 2E,F is confirmed to be the pronephros, which develops into the pronephros duct as seen in F,H. F: Ventral cells and the end of the notochord faintly express id2 at 22 hours postfertilization (hpf). G: Transcripts in the neural crest and floor plate (white dotted triangle). H: Transcripts in the neural crest and pronephros duct. c, cerebellum; dr, dorsal retina; e, ear; h, hindbrain; hyp, hypothalamus; n, notochord; nc, neural crest; nt, neural tube; pd, pronephric ducts; rl, rhombic lip; t, telencephalon; trg, trigeminal ganglion; yse, yolk cell extension; vs, ventral somites. Scale bars = 50 μ m. EXPRESSION / LABELING:
|
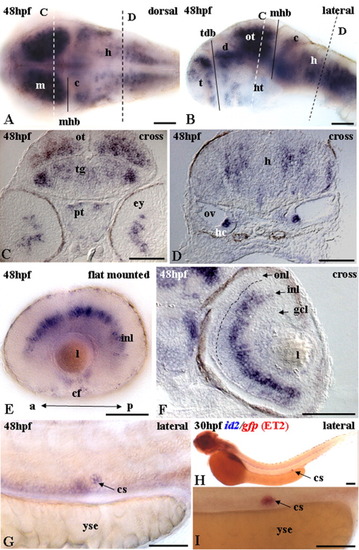
Expression of id2 at the end of the second day of development. A,B,E,G: Whole-mount; A: dorsal view; B,E,G: lateral views; C,D,F: cross-sections. A: Expression in the midbrain, cerebellum, and hindbrain. B: Lateral view of A gives a different perspective. Expression in dorsal and ventral telencephalon, hypothalamus, midbrain, cerebellum and other cells within the hindbrain. Eyes dissected out to enhance clarity of the brain region. C: Optic tectum, tegmentum, and posterior tuberculum express id2. D: Transcripts in the precursors associated with glia and hair cells. E: Flat-mounted dissected left eye shows transcripts in the inner nuclear layer. Expression is confirmed by transverse section in F. F: Expression in the inner nuclear layer. Broken line indicates the outer plexiform layer. G: Transcripts detected in the corpuscles of Stannius (cs), a single small cluster of cells on each side of the ventral trunk, just above the pronephros duct and near the end of the yolk sac extension. H: ET2 transposon line (tagging the acetyl coenzyme A gene) expresses green fluorescent protein (GFP) in the cs (Parinov et al. [2004]). Double staining with id2(blue) and gfp(red) on ET2 line. Expression of id2 colocalized with that of gfp in the cs of ET2 line. I: High magnification showing colocalization of id2 with gfp in cs of embryo in H. a, anterior; c, cerebellum; cf, choroid fissure; d, diencephalon; ey, eye; h, hindbrain; hc, hair cells; ht, hypothalamus; gcl, ganglial cell layer; inl, inner nuclear layer; l, lens; m, midbrain; mhb, midbrain-hindbrain boundary; onl, outer nuclear layer; ot, optic tectum; ov, otic vesicle; p, posterior; pt, posterior tuberculum; t, telencephalon; tdb, telen-diencephalic boundary; tg, tegmentum; yse, yolk cell extension. Dashed lines on A and B indicates position of cross-sections shown on C and D. Scale bars = 50 μ m. EXPRESSION / LABELING:
|

id2 expression is down-regulated in mind bomb mutants. A-F: Whole-mount; A,D,G,J: control; B,E,H,K: mibtfi91; C,F,I,L: mibta52b. A-C: Dorsal views (eyes at different focal depth at dorsal part of embryo). A-C: Comparison between control and mind bomb mutants show differences in expression in the midbrain, cerebellum, otic vesicle, and hindbrain cells. D-F: Lateral views provide a different perspective of id2 expression in dorsal and ventral telencephalon, hypothalamus, midbrain, cerebellum, otic vesicle, and hindbrain cells. Eyes dissected out to enhance clarity of the brain region in all lateral views. G-L: Cross-sections. G-I: Sibling and mutants showing id2 expression in cells of optic tectum, tegmentum, and hypothalamus and the amacrine cells expressing id2. J-L: Hindbrain showing id2 transcripts in the precursors associated with glia and hair cells. White dashed lines in A-C indicate the level of the section. c, cerebellum; d, diencephalons; ey, eye; h, hindbrain; hc, hair cells; ht, hypothalamus; IV, fourth ventricle; j, jaw; l, lens; m, midbrain; mhb, midbrain-hindbrain boundary; ot, optic tectum; ov, otic vesicle; pt, posterior tuberculum; r, retina; r6, rhombomere 6; sc, spinal cord; t, telencephalon; tg, tegmentum; yc, yolk cell. >, +, *, and # are examples that indicate corresponding areas in the wild-type and mind bomb mutants where id2 expression is different. Scale bars = 50 μ m. EXPRESSION / LABELING:
|