
- Title
-
Cellular and molecular analyses of vascular tube and lumen formation in zebrafish
- Authors
- Jin, S.W., Beis, D., Mitchell, T., Chen, J.N., Stainier, D.Y.
- Source
- Full text @ Development
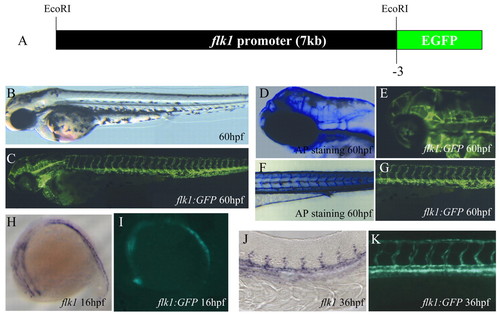
Generation of the Tg(flk1:EGFP)s843 line. (A) A 6.5 kb upstream sequence of zebrafish flk1 was used to generate the Tg(flk1:EGFP)s843 line. (B) Bright-field micrograph of a 60 hpf Tg(flk1:EGFP)s843 embryo. (C) Epifluorescence micrograph of the same embryo. (D) Head vasculature of a 60 hpf embryo visualized by endogenous alkaline phosphatase (AP) activity. (E) Similar area in a Tg(flk1:EGFP)s843 embryo. (F) Trunk vasculature of a 60 hpf embryo visualized by endogenous AP activity. (G) Similar area in a Tg(flk1:EGFP)s843 embryo. (H) flk1 expression at 16 hpf in a 16 hpf embryo. (I) Expression of GFP at the same stage. (J) flk1 expression at 36 hpf in a 36 hpf embryo. (K) Expression of GFP at the same stage. The flk1:EGFP transgene recapitulates flk1 expression and allows higher resolution analyses than staining for flk1 expression or AP activity. EXPRESSION / LABELING:
|

Angioblasts migrate directly on top of the endodermal layer. Transverse sections of Tg(her5:EGFP)ne2067 embryo (A-C) and Tg(flk1:EGFP)s843; Tg(her5:EGFP)ne2067 embryo (D-I) visualized for GFP (green) (A,D,G), ß-catenin (red) (B,E,H) and fibronectin (blue) (C,F,I). The sections shown are at the level of the 6th somite. White arrowheads mark migrating angioblasts localized right on top of the endodermal layer (outlined by a broken white line). ß-Catenin staining outlines the endodermal layer. NT, neural tube; NC, notochord. |

Angioblast migration to the midline. (A-E) Transverse sections visualized for GFP (green), fibronectin (blue) and ß-catenin (red). The GFP (green) and fibronectin (blue) signals of the outlined areas are also shown separately. The sections shown are at the level of the 6th (A,B), 10th (C) and 14th (D,E) somite. White arrowheads in A and B mark angioblasts that are still residing within the LPM and that will migrate during a second wave. White arrowheads in C show fibronectin deposition around a single endothelial cell within the vascular cord. Over the span of 14 hours, the angioblasts migrate to the midline where they aggregate to form a vascular cord that subsequently lumenizes. NT, neural tube; NC, notochord; DA, dorsal aorta; PCV, posterior cardinal vein. |
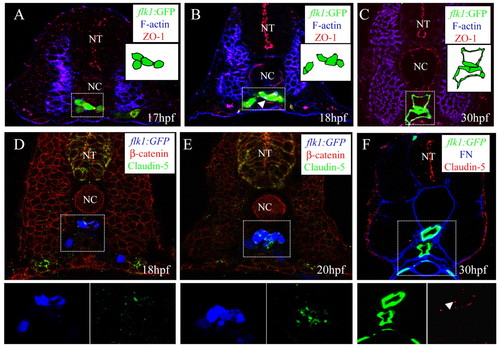
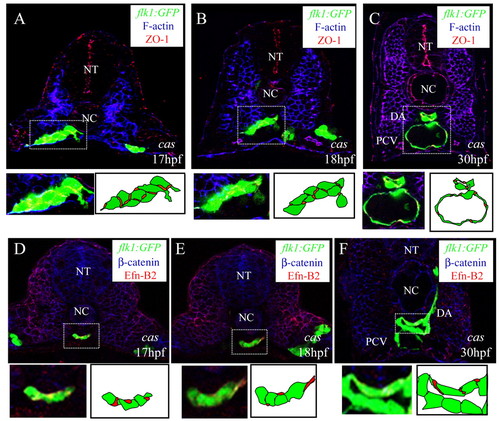
Junction formation between endothelial cells in the vascular cord. Transverse sections visualized for: (A-C) GFP (green), filamentous actin (blue) and ZO1 (red); (D,E) GFP (blue), claudin 5 (green) and ß-catenin (red); (F) GFP (green), fibronectin (blue) and claudin 5 (red). The sections shown are at the level of the 7th (A), 10th (B,D,E), and 14th (C,F) somites. Schematic drawings of the outlined areas are shown as insets (A-C). The GFP and claudin 5 signals of the outlined areas are shown separately as insets as blue and green channels, respectively (D,E) and green and red channels, respectively (F). Junctions form between endothelial cells after they reach the midline. NT, neural tube; NC, notochord. Arrowheads in B,F indicate ZO1 and claudin 5 localization, respectively. |
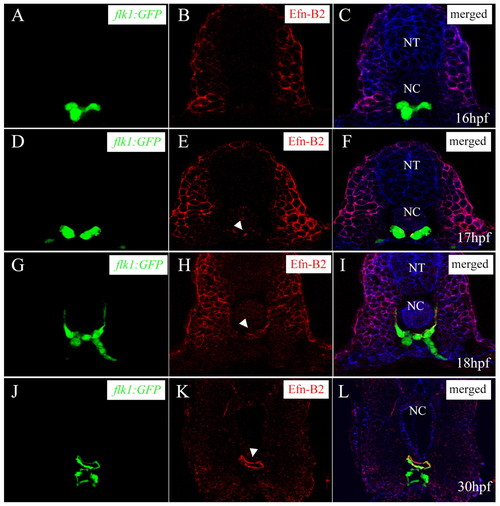
Differentiation of arterial endothelial cells within the vascular cord. Transverse sections visualized for GFP (A,D,G,J) (green), ephrin B2 (B,E,H,K) (red) and ß-catenin (C,F,I,L) (blue). Sections shown are at the level of the 7th (A to C), 10th (D to F), and 14th somite (G to L). Arrowheads mark the ephrinB2 expression within the vascular cord. Subsets of angioblasts within the vascular cord start to express ephrin B2 at 17 hpf, and this expression later becomes restricted to the DA. NT, neural tube; NC, notochord. |
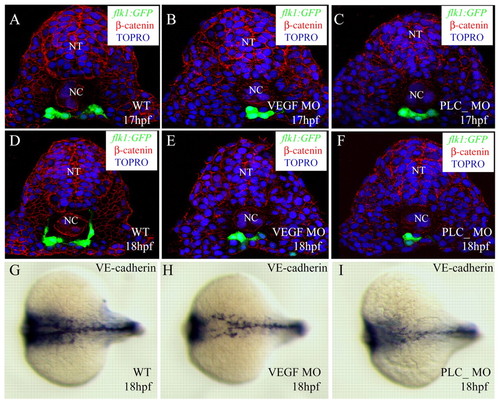
Cell number is not crucial for angioblast migration. Transverse sections of embryos with compromised VEGF signaling visualized for GFP (green), ß-catenin (red) and TOPRO (blue) (A-F), and in situ hybridization with VE-cadherin (cdh5) (G-I). The sections shown are at the level of the 6th somite (A-F). Control embryos (A,D,G), vegf MO-injected embryos (B,E,H), plcg1 MO-injected embryos (C,F,I). The angioblasts in embryos with compromised VEGF signaling are in a similar position to those in control embryos, while the numbers of angioblasts are significantly reduced. NT, neural tube; NC, notochord. EXPRESSION / LABELING:
|

Angioblast migration in endodermless embryos. Transverse sections of endodermless embryos Tg(flk1:EGFP)s843;cas mutants visualized for GFP (green), fibronectin (blue), and ß-catenin (red). The GFP (green) and fibronectin (blue) signals of the outlined areas are shown separately (A-E). The sections shown are at the level of the 6th (A,B), 10th (C), 14th (D) and 18th (E) somites. White arrow in A shows a cluster of angioblasts exiting the LPM. Despite the absence of endoderm, angioblasts migrate to the midline. NT, neural tube; NC, notochord; DA, dorsal aorta; PCV, posterior cardinal vein. |
Junction formation and arterial endothelial cell differentiation in endodermless embryos. Transverse sections of endodermless embryos. Tg(flk1:EGFP)s843;cas mutants visualized for: (A-C) GFP (green), filamentous actin (blue) and ZO1 (red); and (D-F) GFP (green) ephrin B2 (red) and ß-catenin (blue). The sections shown are at the level of the 6th (A,D), 10th (B,E), and 14th somites (C,F). The outlined areas are magnified and shown with schematic drawings. Despite the absence of endoderm, differentiation of angioblasts into arterial and venous endothelial cells occurs as in wild-type embryos. NT, neural tube; NC, notochord; DA, dorsal aorta; PCV, posterior cardinal vein. |

Endothelial precursor migration in TG(flk1:EGFP)s843 embryos. Epifluorescence micrographs of Tg(flk1:EGFP)s843 embryos are shown in dorsal views (A-D,I,J) and lateral views (E-H,K,L). Embryo at 14 hpf (A,E), 16 hpf (B,F), 17 hpf (C,G), 18 hpf (D,H), 20 hpf (I,K) and 24 hpf (J,L). |
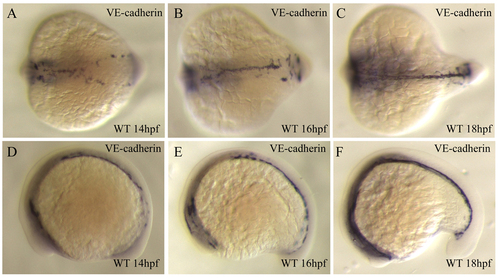
Pan-endothelial marker VE-cadherin (cdh5) expression during angioblast migration. Micrographs of in situ hybridization with VE-cadherin. Embryos at 14 hpf (A,D), 16 hpf (B,E) and 18 hpf (C,F), in dorsal (A-C) and lateral views (D-F). EXPRESSION / LABELING:
|
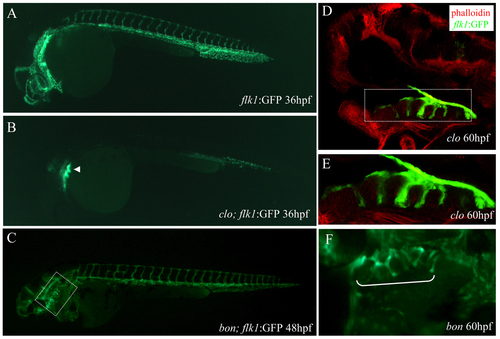
Pharyngeal expression of flk1:GFP in cloche and bonnie and clyde mutant embryos. Epifluorescence micrographs of a Tg(flk1:EGFP)s843;clo mutant embryo (B) and a sibling (A) at 36 hpf, and a Tg(flk1:EGFP)s843;bon mutant embryo at 48 hpf (C). The outlined area in C is shown in F. Longitudinal section of a clo mutant embryo at 60 hpf, visualized for GFP (green) and filamentous actin (red) (D). The outlined area in D is shown in E. White bracket in F marks the pharyngeal region. The pharyngeal GFP expression is present in Tg(flk1:EGFP)s843;clo mutant embryos (arrowhead in B; D,E), while severely reduced in Tg(flk1:EGFP)s843;bon mutant embryos (F), suggesting that it is localized in endodermal tissues. |
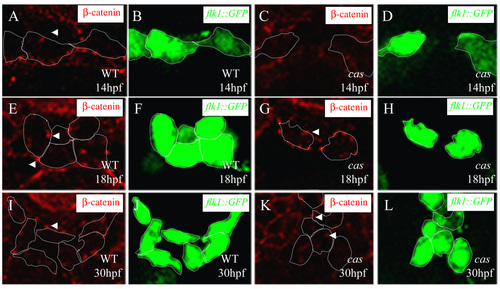
Adherens junction formation during vascular development. Transverse sections of wild-type embryos (A,B,E,F,I, J) and endoderm-less embryos [Tg(flk1:EGFP)s843;cas mutants] (C,D,G,H,K,L) visualized for &b;-catenin (red) (A,C,E,G,I,K) and GFP (green) (B,D,F,H,J,L). The sections are at the level of the 6th (A-H) and 12th somite (I-L). White arrowheads indicate adherens junctions between endothelial cells, which appear after the cells reach the midline. |
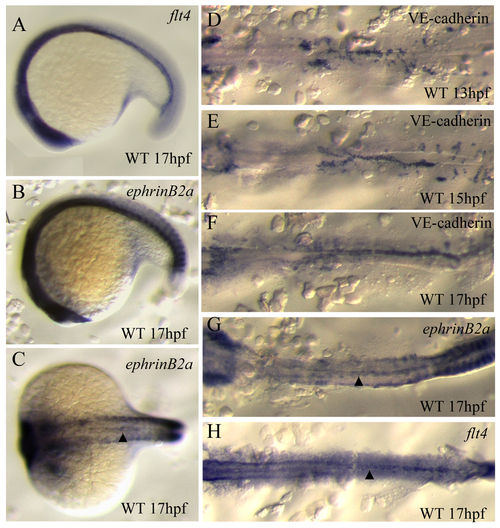
Expression of arterial and venous specific markers at the time of differentiation. Micrographs of in situ hybridization with flt4 (A,H), ephrinB2a (B,C,G) and VE-cadherin (cdh5) (D-F). Embryos at 13 hpf (A,D), 15 hpf (B,E) and 17 hpf (C,F), in lateral (A-B) and dorsal views (C-H; flat-mounted in D-H). Arrowheads in C,G,H indicate vascular expression of ephrinB2a (C,G), and flt4 (H). Both ephrinB2a and flt4 are expressed in the angioblasts located at the midline, but not those in the lateral plate mesoderm. Detailed expression patterns of arterial and venous endothelial cell markers can be found at the ZFIN website (www.zfin.org). EXPRESSION / LABELING:
|