
- Title
-
Lhx2 mediates the activity of Six3 in zebrafish forebrain growth
- Authors
- Ando, H., Kobayashi, M., Tsubokawa, T., Uyemura, K., Furuta, T., and Okamoto, H.
- Source
- Full text @ Dev. Biol.

Expression of lhx2 and lhx9 mRNA in the zebrafish embryo. (A) Expression of lhx2 in the presumptive forebrain at the early somitogenesis stage (11 hpf) (A), at 24 hpf (B) and at 32 hpf (C, D). (E–H) Expression of lhx9 in the zebrafish brain at the same stages as A–D. (A–C, E–G) Dorsal views, anterior up; (D, H) lateral views, anterior left, dorsal up. t, telencephalon; ov, optic vesicles; white arrowhead (C) and e (D), epiphysis; black arrowheads, hindbrain segments; asterisk, mid–hindbrain boundary. (I) Double labeling of lhx9 expression (purple) and primary neurons (brown) by in situ hybridization and α-Tb immunostaining in a 30-hpf embryo. poc, postoptic commissure; TPOC, the tract of the postoptic commissure; arrowheads, complementally localization of lhx9-expressing cells and the reticulospinal neurons in the hindbrain. Scale bar, 100 μm. EXPRESSION / LABELING:
|
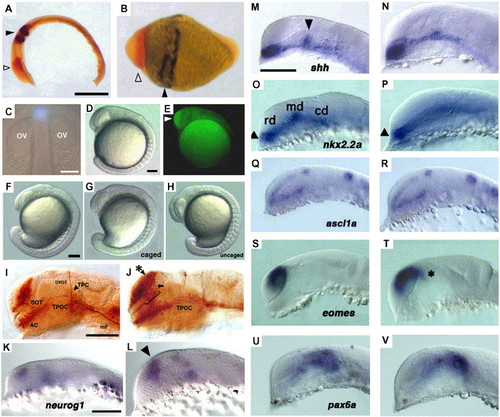
Comparison of the effect of ubiquitous Lhx2 overexpression with that of head-specific photoactivation of caged-lhx2 mRNA. (A) Two-color in situ hybridization of an uninjected embryo at 15 hpf. Red signal shows pax6a expression in the head, and dark stripes show egr2b expression in the hindbrain. (B) Two-color in situ hybridization in the Lhx2-overexpressing embryo at 15 hpf. Embryo showed severe dorsalization as well as anteriorization at this stage. Open arrowhead points to the expanded region of pax6a expression in the enlarged head, and closed arrowhead points to the expanded region of egr2b expression. (A, B) Lateral view, anterior left and dorsal up. Scale bar: 200 μm. (C–H) Uncaging by spot UV illumination induced head-specific overexpression of Lhx2:GFP fusion protein. (C) Spot UV illumination, 36 μm in diameter, with 365-nm light (shown as blue spot) of the presumptive forebrain of a 12-hpf embryo to uncage lhx2:gfp fusion mRNA. Illumination was provided by a 100-W mercury lamp for 1.0 s using a 10-fold objective lens and a 200-μm pinhole slide inserted at the confocal plane of the light pathway. ov, optic vesicles. (D) Head-uncaged embryo at 16 hpf. (E) Fluorescence microscopy image of the head-uncaged embryo shown in panel D. GFP fluorescence was only detected in the head (white arrowhead). (F–H) Morphology of embryos at 18 hpf. (F) An uninjected embryo. (G) An embryo injected with caged-fusion mRNA without uncaging treatment. (H) An embryo injected with caged-fusion mRNA and uncaged in the head at 12 hpf. (I, J) Immunostaining of the primary neurons with α-Tb of a 24-hpf uninjected (I) and head-uncaged embryo (J). Asterisk in panel J points to the ectopic neurons in the dorsal telencephalon that extend their axons in the defasciculated supraoptic tracts (arrow and bracket) toward the rostral TPOC. TPOC, tract of the postoptic commissure; SOT, supraoptic tract; TPC, tract of the posterior commissure; DVDT, dorsoventral diencephalic tract; AC, anterior commissure; mlf, medial longitudinal fascicle. (K, L) neurog1 expression at 17 hpf in uninjected (K) and head-uncaged embryo (L). Arrowhead in panel L shows expanded neurog1 expression. Scale bar, 100 μm. (M–V) Comparison of the expression patterns of brain marker genes in the uninjected (M, O, Q, S, U) and in the head-specific lhx2 mRNA-uncaged embryos (N, P, R, T, V). (M, N) shh expression at the 18-somite stage. Arrowhead in panel M points to dorsal shift of shh expression domain at the mid–diencephalic boundary. (O, P) nkx2.2a expression at the 18-somite stage. Arrowheads point to the optic recess of each embryo. rd, md, cd, rostral domain, medial domain, caudal domain of nkx2.2a expression in the uninjected embryo. (Q, R) ascl1a expression at 20 hpf. (S, T) eomes expression at 18 hpf. Asterisk in panel T points to dorsal extension of eomes expression. (U, V) pax6a expression at 24 hpf. Scale bar (M–V), 100 μm. EXPRESSION / LABELING:
|

Cross-reactive knockdown effect of six3-AMO against six3b and six3a expression. (A) Expression of GFP fluorescence in the nuclei of blastoderm cells in the embryos injected with mRNA for fusion protein of Six3b and GFP (six3b:gfp) alone (upper panels), and the absence of GFP fluorescence in the embryos co-injected with six3b:gfp and six3-AMO (bottom panels). (B) Expression of GFP fluorescence in the nuclei of blastoderm cells in the embryos injected with mRNA for fusion protein of Six3a and GFP (six3a:gfp) alone (upper panels) and the absence of GFP fluorescence in the embryos co-injected with six3a:gfp and six3-AMO (bottom panels). In each panel, the left side shows the dissecting microscopic images, and the right side shows the fluorescent microscopic images. Stage for observation, 3 hpf. |
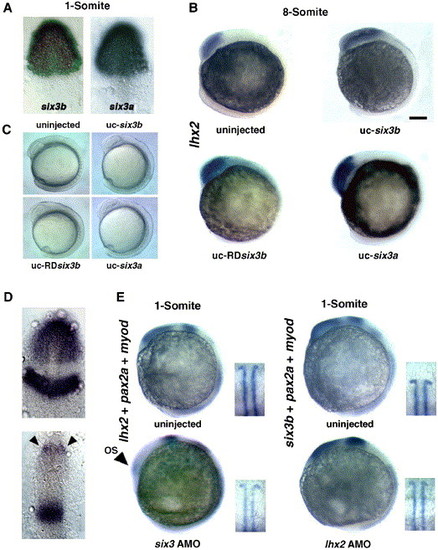
Enhancement of lhx2 expression in a head-specific Six3a- and Six3b-overexpressing embryo by uncaging mRNA for six3a and six3b and severe downregulation of lhx2 expression in a six3-knockdown embryo. (A) six3b and six3a expression in the presumptive forebrain in the 11-hpf embryo (left and right, respectively). (B) A normal pattern of lhx2 expression in the forebrain in the embryo injected with 20 pg of globin mRNA (upper, left) and enhanced lhx2 expressions in the six3b (upper, right), RDsix3b (bottom, left) and six3a mRNA-uncaged embryo (bottom, right) at the 8-somite stage. Scale bar, 100 μm. (C) Similar degrees of enlargement of the head in six3b, RDsix3b and six3a mRNA-uncaged embryos at the 8-somite stage. (D) Dorsal views of lhx2 expression in the forebrain and pax2a expression in the midbrain–hindbrain boundary at the one-somite stage by co-probing for lhx2 and pax2a in an uninjected embryo (upper panel) and marked decrease of lhx2 expression in the six3-knockdown embryo (bottom panel). Arrowheads point to pax2a expression in the developing optic stalk. (E) lhx2 and six3b expression in the six3- and lhx2-knockdown embryos. The upper pairs of pictures show lhx2 and six3b expression in the uninjected embryos. The bottom left picture shows marked decrease of the lhx2 expression in the six3-knockdown embryo. In this experiment, embryos were also probed for myod. Arrowhead points to pax2a expression in the optic stalk. The bottom right picture shows six3b expression in the lhx2-knockdown embryos. Insets in each picture in panel E show the myod expressions of the same embryos, demonstrating that all embryos are at the one-somite stage. EXPRESSION / LABELING:
|

Rescue of six3-knockdown by conditional overexpression of Lhx2. (A–C) Uninjected embryos at 26 hpf (A) and 18 hpf (B and C). (D–F) Embryos injected with six3-AMO at the same stages. (G–I) Embryos co-injected with six3-AMO and caged-lhx2 mRNA without uncaging at the same stages. (J–L) Embryos co-injected with six3-AMO and caged-lhx2 mRNA that were head-uncaged at 12 hpf at the same stages. Arrowheads in panels D and G point to partially separated optic stalks that suggest incomplete development of the eye. Panels B, E, H and K show eomes expression in the dorsal telencephalon. Panels C, F, I and L show pax2a expression in the optic stalks. Arrowheads show the pax2a expression domains at the midbrain–hindbrain boundary. (M–P) Immunostaining of neurons by α-Tb and fluorescence of GFP in the 26-hpf embryos uninjected (M), injected with six3-AMO (N), injected with six3-AMO plus caged-fusion mRNA (lhx2:gfp) for Lhx2 and GFP with no uncaging (O) and injected with six3-AMO plus caged-lhx2:gfp mRNA that were head-uncaged at 12 hpf (P). In panels M–P, images of GFP fluorescence (pseudo-colored green) in the nuclei of the forebrain were overlaid with the images of axons and neurons detected with α-Tb (pseudo-colored red). Stars in panels N and O show a reduction in the number of neurons in the telencephalon, and the arrowhead in panel O points to a leaky expression of Lhx2:GFP in non-uncaged embryos. The asterisk in panel P indicates an ectopically generated-SOT in rescued embryos. Scale bar, 100 μm. EXPRESSION / LABELING:
|

Six3b cannot rescue the knockdown effect of Lhx2. (A–C) Uninjected embryos at 17 hpf. (D–F) 17-hpf embryos co-injected with lhx2-AMO plus caged-six3b mRNA that was not uncaged. (G–I) 17-hpf embryos co-injected with lhx2-AMO plus caged-six3b mRNA that was head-uncaged at 12 hpf. (J–L) 17-hpf embryos injected with caged-six3b mRNA alone that was head-uncaged at 12 hpf. (B, E, H, K) eomes expression in the dorsal telencephalon. (C, F, I, L) pax2a expression in the optic stalk. Stars point to pax2a expression at the midbrain–hindbrain boundary. (M–P) Immunostaining of the initial axonal scaffold (pseudo-colored red) and GFP fluorescence of fusion protein of Six3b and GFP (Six3b:GFP) (pseudo-colored green) at 26 hpf in the uninjected embryo (M), the embryo co-injected with lhx2-AMO plus caged-six3b:gfp mRNA that was not uncaged (N), co-injected with lhx2-AMO plus caged-six3b:gfp mRNA that was uncaged at 12 hpf (O) or injected with caged-six3b:gfp mRNA alone that was uncaged at 12 hpf (P). Stars in panels N and O show the reduction in the number of neurons in the telencephalon, and the asterisk in panel P indicates the ectopic generation of SOT in six3b:gfp-uncaged embryos as well as dorsal expansion of neurons in the telencephalon (star), showing a similar phenotype in Fig. 5P. Scale bar, 100 μm. EXPRESSION / LABELING:
|

Quantitative estimation of rescue and non-rescue of the six3- and lhx2-knockdown embryos by head-specific overexpression of Lhx2 and Six3b, respectively. Rescue and non-rescue were estimated at 26 hpf based on the size of the head and the eyes in six3- and lhx2-knockdown embryos by head-specific overexpression of Lhx2 and Six3b, respectively. (A) Calculation of the relative size of the head was as follows: head thickness (ht in panel A) / whole body length (bl in panel A) x 100 (%), and the relative size of the eye was calculated as follows: diameter of the eye (de in panel A) / whole body length (bl in panel A) x 100 (%). (B) Relative size of the head (black bars) and the eye (red bars) in the embryos that were uninjected (I), six3-AMO-injected (II), six3-AMO plus caged-lhx2 mRNA-injected (without uncaging) (III), six3-AMO plus caged-lhx2 mRNA-injected (with head-uncaging) (IV) and caged-lhx2 mRNA-injected (with head-uncaging) (V). In each measurement, n = 10. (C) Relative size of the head (black bars) and the eye (red bars) in the embryos uninjected (I), lhx2-AMO-injected (II), lhx2-AMO plus caged-six3b mRNA-injected (without uncaging) (III), lhx2-AMO plus caged-six3b mRNA-injected (with head-uncaging) (IV) and caged-six3b mRNA-injected (with head-uncaging) (V). In each measurement, n = 10. |
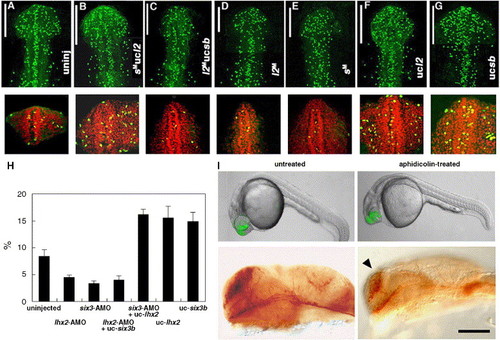
Regulation of the cellular proliferation by Lhx2 and Six3b. The number and the proportion of proliferating cells in the heads of the embryos that were rescued and not rescued at 17 hpf. Proliferating cells were detected by immunostaining with anti-phospho-Histone H3 polyclonal antibody. The nuclei in proliferating cells in the stacked confocal image of the head region (a portion from the rostral-most tip to the caudal-most edge of the optic vesicle) were counted (shown as white bars in A–G, upper panels) in the embryos that were uninjected (A), six3-AMO-injected with lhx2-uncaged (B), lhx2-AMO-injected with six3b-uncaged (C), lhx2-AMO-injected (D), six3-AMO-injected (E), lhx2-uncaged (F) and six3b-uncaged (G). The proportions of the numbers of proliferating cells among all cells in the forebrain were manifested by co-labeling with CYTOX Orange (red) in the frontal view of the cross-sections (2.5 μm) near the anterior end of the telencephalon, and quantification of the proportions (%) was carried out by counting the number of cells which were labeled with anti-phospho-Histone H3 antibody and with CYTOX Orange. (H) The quantified comparison of the proliferating cells among all cells in the cross-sections near the anterior end of the telencephalon. Measurements in each experiment are shown as percentages with the standard error. In each measurement, n = 5. (I) Uncaging of lhx2:GFP mRNA in the forebrain (upper panels) and α-Tb immunostaining of the telencephalic neurons at 24 hpf (lower panels) of the lhx2-uncaged embryos, which were not treated or treated with 75 μM aphidicolin. The arrowhead indicates impaired increase in the number of telencephalic neurons in the uncaged embryos in the presence of aphidicolin. The embryos shown in the upper and lower panels are typical examples, but they are not the same. |
Reprinted from Developmental Biology, 287(2), Ando, H., Kobayashi, M., Tsubokawa, T., Uyemura, K., Furuta, T., and Okamoto, H., Lhx2 mediates the activity of Six3 in zebrafish forebrain growth, 456-468, Copyright (2005) with permission from Elsevier. Full text @ Dev. Biol.