
- Title
-
D-glucuronyl C5-epimerase acts in dorso-ventral axis formation in zebrafish
- Authors
- Ghiselli, G., and Farber, S.A.
- Source
- Full text @ BMC Dev. Biol.

glce mRNA expression pattern in developing embryos. (a) RT-PCR analysis of the transcript level. Thirty embryos were collected in Tri-Reagent at different developmental stages as indicated. cDNA was generated from total RNA (1 µg) using Sensiscript reverse transcriptase primed with oligo-dT at 37°C for 2 h. PCR reactions (25 cycles) were performed in duplicate and analyzed on 1% agarose gel. (b) Glce enzymatic activity in embryos at different developmental stage. At each time point 20 embryos were dechorionated and homogenized. For the enzymatic assay, a cell lysate was incubated (2 h at 28°C) with labeled bacterial K5 heparosan substrate and the 3H2O liberated as result of the epimerization of GlcA into IdoA, measured. The bars represent the mean ± SD of the values from three independent determinations. (c-l) whole-mount in-situ hybridization of glce-a in embryos at different stages of development. (c-j) Top row: lateral views. Bottom row: animal pole views. (c,d) blastoderm at 64 cells stage; (e,f) dome stage; (g,h) shield stage; (i,j) 3 somite stage. (k) 24 hpf embryo showing showing intense glce staining at the perimeter of the forth ventricle as indicated by the arrow-heads. (l) enlargment of the embryo brain forth ventricle area. |
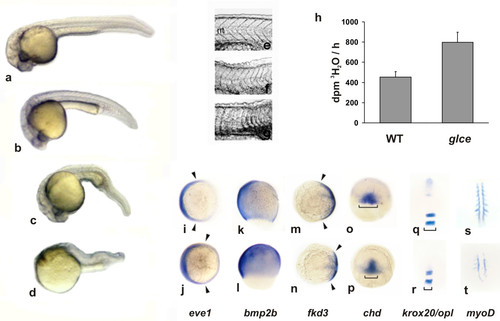
Effect of Glce overexpression on embryo morphogenesis and HS composition. Embryos at 1-2 cells stage were injected with glce-A and/or glce-B mRNA and observed at 24 hpf. (a) wild type embryo. (b,c) mild and moderately ventralized embryos showing enlarged blood sac (indicated by an arrow). (d) Severely ventralized embryos displaying dramatically reduced head and trunk. (e-g) High-contrast images of the somites and the notocord (nt) structures in control (e), and in mildly and moderately ventralized embryos (f,g). Note the loss of chevron-like structure of the somites and the narrowing or disappearance of the notocord in embryos overexpressing glce (f,g). (h) Epimerase enzymatic activity at 10 hpf in controls (WT) and in embryos injected with glce-A plus glce-B mRNA (250 pg each). The enzymatic assay was performed as described in Fig. 2b. (i-t) Whole mount in-situ hybridization with D/V markers in embryos during gastrulation and at 5 somite stage. Top row: wild type embryos. Bottom row: embryos injected with 250 pg each of glce-A and glce-B mRNA. (i,j) eve1 staining viewed from the animal pole at shield stage. The arrowheads point to the edges of the expression range of the marker; (k,l) bmp2b, lateral view with the dorsal side to the right at 70% epiboly; (m,n) fkd3, animal pole view at 70% epiboly; (o,p) chordino, dorsal view at 50% epiboly; (q,r) krox-20/opl double staining (head view) and (s,t) myo-D (dorsal view) in embryos at 5 somite stage. Note in (r) the narrow expression domain of krox20 in embryos injected with glce mRNA whereas opl transcript is undetectable. EXPRESSION / LABELING:
|
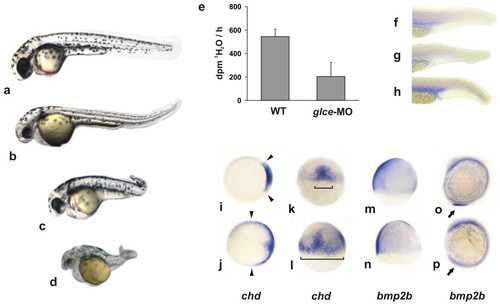
Effect of Glce knockdown on embryo morphogenesis. (a-d) Embryos at 1-2 cells stage were injected with a mix (8 ng each) of glce-A and glceB MO and the phenotype scored at 48 hpf. (a) wild type embryo. (b,c) mild phenotypes displaying reduced head volume and ventral fin extension. (d) severe phenotype with shortened A/P axis and loss of ventral structures. (e) Epimerase enzymatic activity in 10 hpf embryos and effect of Glce knockdown. The enzymatic assay was performed as described in Fig. 2b. (f-p) Whole mount in-situ hybridization with D/V markers of embryos at different developmental stages. (f) gata1 expression in wild-type embryos, (g) glce morphants, and (h) in embryos overexpressing glce at 24 hpf. (i-l) chordino at 50% epiboly in wild type (top) and morphants (bottom). (i,j) animal pole view, (k,l) dorsal view. (m,n) bmp2b at 70% epiboly and (o,p) at 3 somite stage in wild type (top) and morphants (bottom). Note the absence of bmp2b expression in the presumptive tail of the morphants as indicated by the arrows. |