
- Title
-
Quantum dots are powerful multipurpose vital labeling agents in zebrafish embryos
- Authors
- Rieger, S., Kulkarni, R.P., Darcy, D., Fraser, S.E., and Köster, R.W.
- Source
- Full text @ Dev. Dyn.

Quantum dots provide bright vital labeling during zebrafish embryogenesis. A-D: Lateral views of embryo injected with QD605 (100 mM, 1.7 nl) at the two-cell stage. A-D: Bright red fluorescent labeling can be observed during the first cleavage stages (A, weaker labeling of descendants from the uninjected blastomere (white arrowhead) indicates spreading of the quantum dots during first cleavage stages), gastrulation (B), somitogenesis (C), and organogenesis (D) without affecting embryonic development. E: The tendency of QD605 to form aggregates (aqueous QD605 dispersion on a coverslip, see yellow arrowheads for aggregates) results in bright fluorescent clusters in some tissues (D, arrowheads). F,H: These aggregates can be dissolved by sonication (F, sonicated aqueous QD605 dispersion on coverslip) before embryonic injection, resulting in evenly labeled embryos (H). G: Whereas 108 injected quantum dots are being tolerated by developing zebrafish embryos, higher injection amounts appear to interfere with embryogenesis. hpf, hours postfertilization. |

Emission and localization properties of QD605. A-C: Comparison of the emission spectra of QD605 measured in water (A), phosphate buffered saline (PBS, B), and within retinal cells of zebrafish embryos (C) indicates that the QD605 emission spectra remain unaltered in vitro and in vivo irrespective of their environment. Spectroscopy was performed using laser scanning confocal microscopy combined with liquid crystal tunable filters (LSM510 Meta system, Zeiss). The cross hair demarcates the spot from which the spectra were obtained. Relocating the cross hair to different points of fluorescence did not affect the emission spectra significantly. D-G: Comparison of differently localized cellular fluorescent labels within lens fiber and retinal cells in developing zebrafish eyes using laser scanning confocal microscopy; whereas the membrane-localized dye Bodipy Ceramide (D) and the nuclear-localized histon2B-mRFP fusion protein (G) result in a different vital cellular label, the signal obtained from streptavidin-conjugated QD605 (F) appeared to resemble very closely the labeling of the unc76:GFP fusion protein, which labels the cellular cytoplasm but is excluded from the nucleus (E). hpf, hours postfertilization; RFP, red fluorescent protein. |

Lineage tracing of zebrafish embryonic cells using QD605. A: Two blastomeres of a zebrafish embryo at the 64-cell stage (overlay of transmitted light image with QD605 fluorescence) have been coinjected with QD605 and mRNA encoding green fluorescent protein (GFP), an established lineage tracer in zebrafish embryos. B: The restriction to two individual blastomeres can be observed immediately after the injection by the red fluorescence of QD605 using a fluorescence stereomicroscope. C-E: At 30% epiboly (C, overlay of transmitted light image with QD605 fluorescence), green fluorescence emitted by the meanwhile translated GFP can be observed (E) in addition to the red QD605-derived fluorescence (D). Both fluorescent signals are localized to a single continuous cell cluster of approximately 20 cells close to the apical pole of the embryos. F: The overlay of both fluorescent channels shows that both signals overlap completely. This finding indicates that streptavidin-conjugated QD605 do not spread to neighboring cells through gap junctions but are being passed on to descendants of the initially injected blastomeres through rounds of cell divisions. G: At 60% epiboly, the single cell cluster of fluorescent cells has dispersed, likely due to extensive cell movements of gastrulating cells. H,I: Red QD605-derived fluorescence (H) and green GFP-emitted fluorescence (I) can still be detected in numerous cells. J: The overlap of both fluorescent channels shows that most fluorescent cells co-emit GFP and QD605 fluorescence, indicating that streptavidin-conjugated QD605 can be used to mark descendants of individually injected cells. Some cells appear to display green GFP fluorescence only (J, white arrowheads). The lack of QD605 in this subfraction of cells may be caused by QD605 being propagated to only one daughter cell during a round of cell division, due to their tendency to form aggregates. G,J: A few red fluorescent signals emitted from QD605 that do not co-emit GFP fluorescence appear to be derived from quantum dots that are not localized within the embryo, perhaps being deposited between the embryo and the chorion during the injection procedure (compare blue arrowheads in J and G). These results show that streptavidin-conjugated QD605 can be used as lineage tracers in zebrafish embryos to label the vast majority of descendants from an injected individual precursor cell. K-R: To directly follow individual cell dynamics, zebrafish embryos were injected with mRNA (150 ng/μl) encoding a histone2B-EGFP fusion protein at the single-cell stage followed by QD605 injection of an individual blastomere at the 64-cell stage. H: As such labeled cells disperse during gastrulation individually QD605-labeled cells could be followed by time-lapse recording using laser scanning confocal microscopy. Starting at 8 hours postfertilization (hpf) stacks of images spaced by 5 μm, respectively, were recorded every 5 min covering an optical section of 30 μm in total. A sequence from a several-hours recording is displayed with images from a 10-μm fraction of the recorded stacks being projected into single frames by maximum intensity projection. Two cells making and releasing contact (K-P, yellow arrowheads) while undergoing morphological changes can be observed due to the QD605-derived fluorescence of their cytoplasm. Subsequently, the chromatin of one of the labeled cells condenses (O,P, white arrows), and two daughter cells (Q,R, white arrows) arise from a cell division, each carrying the QD605 label. T: To record more elaborate cell morphology, a skin cell from a similarly injected embryo was imaged at 36 hpf. S: In addition, individual notochord cells were injected at 36 hpf with QD605. Pictures from a recorded stack of images (60 μm at 1 μm distance) were projected by maximum intensity projection into a single plane. Due to the bright fluorescent labeling, the polygonal shape of the notochord cell can be appreciated with the nucleus and vacuoles being spared by the fluorescent quantum dots. nc, notochord; sm, somitic muscle. |

Quantum dot microangiography. Living zebrafish embryos of progressing developmental stages were injected into the heart ventricle with a 1 μM suspension of streptavidin-conjugated QD605 to label the vasculature by virtue of the blood flow carrying the quantum dots through the entire vascular network. Subsequently, laser scanning confocal microscopy was used to record the distribution of the quantum dots. A: Lateral view of a 32 hours postfertilization (hpf) embryo; the vasculature is quite primitive, consisting mainly of a major artery and vein running below the notochord (nc). B,C: Injected QD605 attach in clusters to the vascular endothelium (B, maximum intensity projection of 100 sections each 3 μm apart, see also Movie 1 for motility of attached QD605) and accumulate in reticular cells (A, arrowhead; C, maximum intensity projection of 61 sections each 2.5 μm apart). D,E: These deposited QD605 might serve during ongoing embryogenesis as a source to label the endothelium of newly forming blood vessels (55 hpf, D, maximum intensity projection of 100 sections each 3 μm apart; E, maximum intensity projection of 85 sections each 2 μm apart). F-K: At 3 days postfertilization (dpf; F-K, lateral views), the vasculature is by far more elaborate, forming a dense network in the head (F,G, maximum intensity projection of 71 sections each 5 μm apart) and trunk (H,I, maximum intensity projection of 71 sections each 3 m apart). G,I,K: Counterstaining with Bodipy Ceramide was used to visualize the morphological context. L-O: At 5 dpf (L-O, lateral views), the gills (L,M, maximum intensity projection of 51 sections each 5 μm apart) and intestinal region (N,O, maximum intensity projection of 115 sections each 2 μm apart) have acquired a branched vascular network. M,O,Q: Bodipy Ceramide counterstaining. P,Q: Finally, at 9 dpf (dorsal views, maximum intensity projection of 122 sections each 2 μm apart) the vasculature interweaving the midbrain hindbrain region was imaged deep to the ventral brain area. For three-dimensional animations of the vasculature at 3, 5, and 9 dpf, see also Movies 2-4. SIV, subintestinal vein. |
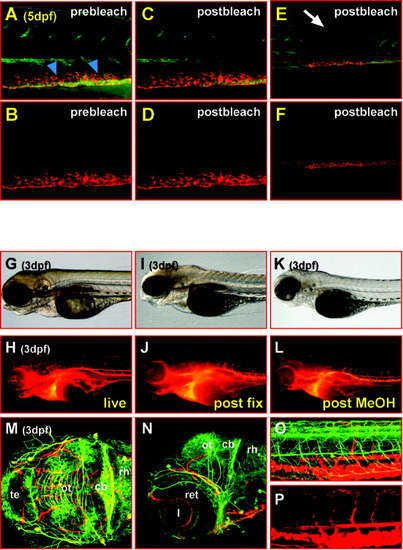
Streptavidin-conjugated QD605 are extremely photostable in vivo and withstand fixation for immunohistochemical analyses. A-F: Lateral views of the trunk of a 5-day-old zebrafish larva that has been soaked overnight in Bodipy Ceramide (green fluorescence) and was subsequently subjected to QD605 microangiography (red fluorescence). Bodipy Ceramide fluorescence in the trunk muscles and notochord diminishes after 150 consecutive 488-nm laser scans (7.9 sec each) of 3.75 mW (compare A and C), whereas the QD605 fluorescence of the reticular cells remains unaltered (compare B and D). E,F: Thus, at lower magnification, an area with bleached Bodipy Ceramide labeling can be observed (E) when compared with adjacent tissue, whereas the strength of the QD605 fluorescence appears equally strong throughout the trunk (F, see also Supplementary Movie 5 for bleaching dynamics). G-L: Lateral views of the head of a 3-day-old zebrafish larva that has been subjected to streptavidin-conjugated QD605 microangiography; strong labeling of the vasculature can be observed in the living specimen (G,H) that remains after fixation overnight in 4% paraformaldehyde in phosphate buffered saline containing 0.1%Tween 20 (I,J) and appears still unaffected after storage in methanol at -20°C and subsequent rehydration (K,L). M-P: Such embryos were subsequently subjected to immunohistochemistry using an antibody against acetylated tubulin to mark axon tracts of differentiating neurons in the brain (M, dorsal view, maximum intensity projection of 49 sections each 2 μm apart; N, lateral view, maximum intensity projection of 29 sections each 2 μm apart; images were recorded using the Meta channel of a Zeiss LSM510 laser scanning microscope, fluorescence was recorded from 499 to 670 nm in steps of 10.7-nm intervals, the emission of both fluorophores was subsequently separated by linear unmixing) and the trunk (O, lateral view, maximum intensity projection of 57 sections each 2 m apart; P, QD605 emission only, to highlight the blood vessel network within the trunk; images were recorded using the Meta channel of a Zeiss LSM510 laser scanning microscope, fluorescence was recorded from 499-670 nm in steps of 10.7-nm intervals, the emission of both fluorophores was subsequently separated by linear unmixing) for double-labeling purposes. This finding shows that blood vessels obey the segmented pattern of the brain and trunk. cb, cerebellum; l, lens; ot, optic tectum; ret, retina; rh, rhombencephalon; te, telencephalon; dpf, days postfertilization. |
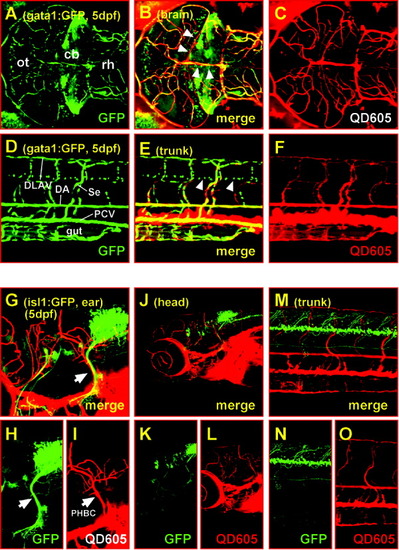
Combining green fluorescent protein (GFP) and quantum dot fluorescence in living specimens. A-C: Maximum intensity projection of 82 sections each 1.97 μm apart; dorsal views of the midbrain and anterior hindbrain of a 5-day-old homozygous gata1:GFP (strain 781) zebrafish larvae. Laser scanning confocal microscopy with excitation at 488 nm reveals both green fluorescent blood vessels and cell clusters in the brain due to GFP expression in erythrocytes and distinct neuronal populations (see also Movie 6 for their three-dimensional organization). C: The vasculature also displays an intense red fluorescence due to quantum dots carried along with the blood serum. B: Note that the signal from the neuronal clusters does not appear in the red channel and is not double stained in the merged image, indicating that there is no bleeding of the GFP fluorescence into the red channel. Thus, both fluorescent signals can be separated using conventional filter sets. D-F: In the lateral views of the trunk of the same specimen, all the characteristic blood vessels can be detected by both GFP (D) and quantum dot (F) fluorescence, demonstrating that both fluorophores can be efficiently separated when colocalized within the same structure (note the exclusively green signal of GFP-expressing cells in the ventral neural tube, white arrowheads in E). G-O: Projections of image stacks recorded by laser scanning confocal microscopy. Lateral views of heterozygous 5-day-old islet1:GFP zebrafish larvae after QD605 microangiography. The GFP-expressing vagus sensory ganglion (H, white arrow) and the primordial hindbrain channel (I, white arrow) appear to share a common trajectory (G, maximum intensity projection of 35 sections each 1.97 μm apart) also verified by three-dimensional re-sectioning. This coprojection does not appear to be characteristic for the majority of axon tracts (K) and blood vessels (L) in the brain (J, maximum intensity projection of 100 sections each 3.03 μm apart) and trunk (M-O, maximum intensity projection of 49 sections each 1.98 μm apart), respectively. cb, cerebellum; DA, dorsal aorta; DLAV, dorsal longitudinal anastomotic vessel; ot, optic tectum; PCV, posterior cardinal vein; PHBC, primordial hindbrain channel; rh, rhombencephalon; Se, intersegmental vessel; dpf, days postfertilization. |