
- Title
-
Hedgehog regulated Slit expression determines commissure and glial cell position in the zebrafish forebrain
- Authors
- Barresi, M.J., Hutson, L.D., Chien, C.B., and Karlstrom, R.O.
- Source
- Full text @ Development

Gfap-expressing cells in the commissure regions of the zebrafish forebrain. (A) Diagram of forebrain tracts and commissures. Commissural axons (green) cross the midline to form the anterior commissure (AC) and the postoptic commissure (POC). Retinal ganglion cells (RGCs) from the eye form the optic nerve and optic chiasm (OC). (B) Localization of RGC (arrowheads), AC and POC axons [immunolabeled with anti-acetylated tubulin (AT); green] in relation to Gfap+ cells (anti-Gfap; red) at 30 hpf. Gfap+ cells span the midline in the region of the AC (dashed bracket) and POC (solid brackets). (C,D) pax2a in situ labeling (red) of the optic stalk region in relation to axons (blue, arrows) and Gfap+ cells (green, brackets) at 27 hpf. (E,F) shh in situ labeling (red) in relation to axons (blue, arrows) and Gfap+ cells (green, brackets). (B,C,E) Frontal views of the forebrain, anterior/dorsal up; (D,F) lateral views, anterior left, anterior/dorsal up. Because brain flexure brings dorsal structures into an anterior position, `anterior′ and `posterior′ will be used in subsequent figures, to reflect the eventual positions of these two commissures. |
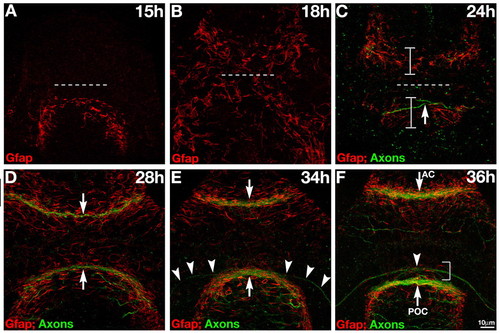
Gfap+ cells span the midline prior to formation of forebrain commissures. (A-F) Double labeling for axons (anti-AT; green) and Gfap+ cells (red). (A) Gfap+ cells span the midline posterior to the optic recess (dashed line) at the presumptive POC at 15 hpf. (B) By 18 hpf, Gfap+ cells span the midline, anterior and posterior to the optic recess (dashed line), at the presumptive AC and POC. (C) By 24 hpf, more distinct glial bridges (brackets) have formed at the presumptive AC and the forming POC (arrow). (D) At 28 hpf both commissures (arrows) have formed in association with the glial bridges. (E) The first RGC axons (arrowheads) grow towards the midline along Gfap+ cells at 34 hpf. (F) The optic chiasm (arrowhead) forms in association with a distinct cluster of Gfap+ fibers just anterior to the POC (bracket). At 15 hpf and 18 hpf, no axons are present in the forebrain (these data) (Wilson et al., 1990), so the green channel was omitted to reduce background. All panels show frontal views of the forebrain. Scale bar: 10 μm. EXPRESSION / LABELING:
|
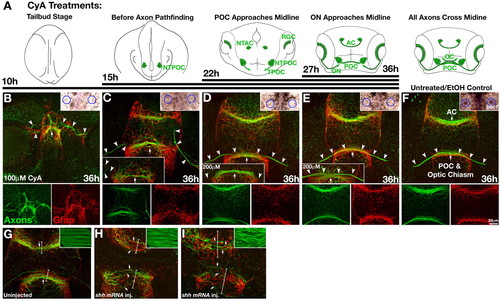
Timed inhibition of Hh signaling with cyclopamine. (A) Diagrams showing the position of forebrain axons (green) at the time cyclopamine (CyA) was applied and the duration of CyA treatment (black lines). (B-I) Frontal views of the forebrain double labeled for axons (anti-AT, green) and glial cells (anti-Gfap, red) at 36 hpf following treatment with 100 μM CyA starting at 10 hpf (B), 15 hpf (C), 22 hpf (D) and 27 hpf (E), and at 34 hpf in uninjected (G) and shh mRNA-injected (H-I) embryos. (F) EtOH (CyA carrier)-treated control embryo. (B-F) Bottom panels show separated red and green channels; upper insets show ptc1 gene expression in the fin buds (circled). (B) Treatment with 100 μM CyA from 10 hpf to 36 hpf resulted in major disruption of forebrain midline development, complete disorganization of forebrain axons (arrowheads) and glial cells, and complete loss of ptc1 expression in fin buds (circles, upper right inset). (C) Treatment with 100 μM CyA from 15 hpf to 36 hpf resulted in ipsilateral RGC projections (arrowheads), a reduced (n=13; C, lower inset) or defasciculated (n=16) POC (arrows), disorganized glial cells around the POC, and complete loss of ptc1 in fin buds (circles, upper right inset). (D,E) AC, POC (arrows) and RGC (arrowheads) axons cross the midline normally in embryos treated with CyA starting at 22 hpf and 27 hpf. CyA treatment (200 µM) gave the same results (lower insets). Again, the limb buds lacked ptc1 expression (circles, upper right insets). (F) Normal commissure, chiasm and glial bridge formation in EtOH-treated control embryos. Inset shows normal limb bud ptc1 expression (circles, upper right inset). (G-I) Analysis of axons and astroglial cells following shh mRNA injection. (G) Uninjected embryo. (H) Following low levels of Hh activation (approximate doubling of superficial slow muscle fibers; anti-F59, green, inset), the AC was dramatically reduced, the POC was highly defasciculated, RGC axons were absent (green, arrows), and glial bridges were expanded (red, brackets). (I) Following high levels of Hh activation (complete transfating of the entire somite into slow muscle fibers; inset), the AC was similarly reduced, the POC was severely reduced and exhibited wandering axons, RGC axons were absent (green, arrows), and expansion of the glial bridges was more pronounced (red, brackets). NTPOC, Nucleus of the tract of the POC; NTAC, nucleus of the tract of the AC; ON, optic nerve; OC, optic chiasm. EXPRESSION / LABELING:
|

The post-optic glial bridge is disrupted in yot (gli2DR) mutants. Axons (anti-AT; green) and Gfap+ cells (red) at 20 hpf (A,D), 24-25 hpf (B,E), and 36 hpf (C,F) in wild type (WT; A-C) and yot (gli2DR) mutants (D-F). (D-F) POC and RGC axons do not cross the midline in yot (gli2DR) mutants (E,F, arrowheads) (Karlstrom et al., 1999). Gfap+ cells are reduced at the midline in the region where the POC would normally form (right brackets), and spread into the pre-optic area (left brackets). Frontal views, anterior up, dotted line marks the optic recess. EXPRESSION / LABELING:
|
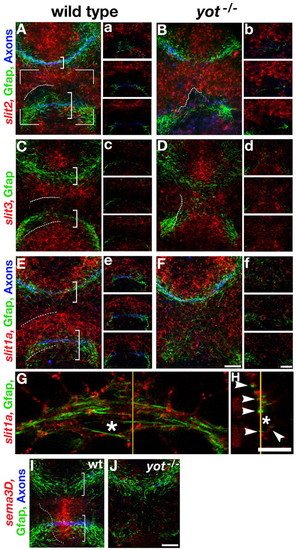
slit and sema3d expression in wild type and yot(gli2) mutants. (A-J) Triple (A-F,I,J) and double (G,H) labeling shows mRNA expression (red) in relation to axons (anti-AT, blue, not shown in C and D) and glial cells (anti-Gfap, green) in the commissural region of the forebrain at 27 hpf in wild type (A,C,E,G-I) and mutants (B,D,F,J). (a-f) Single confocal slices through the preoptic and POC/chiasm region (boxed in A) from superficial (top) to deep (bottom). (A,C) slit2 and slit3 expression is mostly absent from the pre-optic area, the POC/chiasm region (lower bracket), and the AC region (upper bracket) in wild-type embryos. Dotted lines show borders of expression. (E) Slit1a is expressed in complementary domains to slit2/slit3 and is present in the pre-optic area (between dotted lines). (G,H) Higher power single 0.56 μm confocal slices of wild-type embryo showing frontal (G) and lateral (H) views of slit1a expression (red) in the pre-optic area and the glial bridge cells. Gfap+ fibers appear to overlap with slit1a expression (arrowheads). The asterisk marks the same nucleus in both panels. Orange lines indicate the position of cross section in other panels. (I) Sema3d is expressed at the midline from the POC (lower bracket) to the optic recess. (B,D) In yot (gli2DR) mutants, slit2 and slit3 expression is expanded into the POC/chiasm region (dotted line shows the border of expression in the pre-optic area). (F) Unlike slit2 and slit3, slit1a expression is reduced in the POC/chiasm region of yot (gli2DR) mutant embryos. (J) sema3d expression is absent in the pre-optic area of yot(gli2) mutants. All panels except H show frontal views of the forebrain, anterior up. Scale bars: 10 μm. EXPRESSION / LABELING:
|
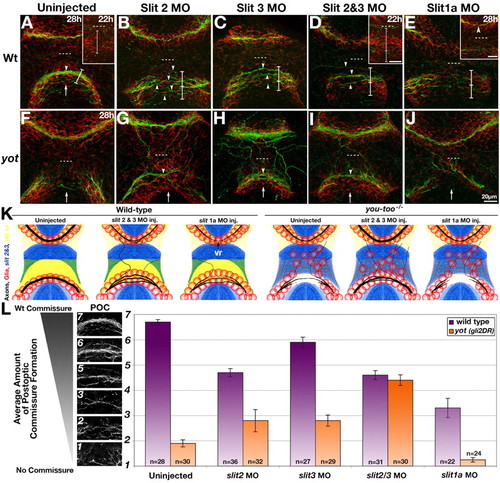
Morpholino knockdown of slit2, slit3 and slit1a in wild type and yot (gli2DR) mutants. (A-J) Double labeling showing axons (anti-AT, green) and glial cells (anti-Gfap, red) in the forebrain at 28 hpf. (A) wt uninjected controls at 28 hpf and 22 hpf (inset). (B-D) Injection of MOs to slit2 (B), slit3 (C), or slit2 and slit3 together (D), into wild type resulted in defasciculation of the POC (arrowheads) and spreading of the glial bridge (brackets, lower division of bracket shows expansion beyond the bridge width seen in uninjected controls). This spreading of the glial bridge was also present prior to the appearance of POC axons (A,D, insets of POC region at 22 hpf, brackets). (E) slit1a MO-injected embryo with reduced AC and POC. Inset shows slit1a morphant with normal AC (arrowhead) and reduced POC. (F-J) yot (gli2DR) mutant embryos. (G-I) Injection of slit2 MOs (G), slit3 MOs (H), or slit2 and slit3 MOs together (I), into yot (gli2DR) mutant embryos resulted in a dramatic rescue of commissure (arrowheads) and glial bridge (arrow) formation. (J) By contrast, MO knockdown of slit1a in yot (gli2DR) mutants did not rescue POC or glial bridge formation. Dotted lines mark the optic recess. (K) Summary of results of slit MO knockdown on axons (black) and glia (red) relative to slit2/slit3 (blue) and slit1a (yellow) expression in wild type and yot (gli2DR) mutant embryos. vr, variably reduced. (L) Semi-quantitative analysis of POC formation following slit MO injections into wild type (purple bars) and yot (gli2DR) mutants (orange bars). Axon phenotypes were binned into seven categories ranging from no axons crossing (1) to a qualitatively wild-type POC (7); illustrated on left. Values represent the mean±s.e.m. All differences between injected embryos and corresponding uninjected controls are significant (Mann-Whitney U-Test, P=0.003-0.0001). No significant difference in commissure formation was found between slit2 + slit3 MO injection into wild type versus yot (gli2 DR) mutant embryos. EXPRESSION / LABELING:
|
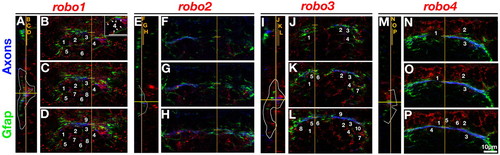
Single slice confocal analysis of Robo expression (red) in relation to axons (anti-AT, blue) and glial cells (anti-Gfap, green) in the POC/chiasm region. (A,E,I,M) Sagittal slice of anterior forebrain, anterior to the left with the POC/chiasm region outlined in white. Lettered orange lines show the positions of accompanying sections. (B-D) Frontal views of the POC/chiasm region displayed in consecutive 0.4 μm slices from superficial (B) to deep (D). Vertical and horizontal orange lines denote the location of the sagittal section in A. robo1 expression directly overlaps with Gfap+ fibers (A, outlined area; B-D, numbered nuclei). Inset in B shows a higher magnification of cell #4, arrowheads point to overlapping expression of robo1 and gfap. (F-H) Single slices separated by 0.8 μm. robo2 is expressed exclusively below Gfap+ cells (E, white line denotes separation between Gfap+ fibers and robo2 expression). (J-L) Single slices separated by 1.2 μm. robo3 expression directly overlaps with Gfap+ fibers in the POC/chiasm region (I, outlined area; J-L, numbered nuclei). (M-P) Single slices separated by 0.8 μm. Only the anterior subset of Gfap+ cells overlaps with robo4 expression (M, top bracket; N-P, numbered nuclei). Scale bar: 10 μm. Nuclei of Robo/Gfap co-expressing cells are numbered in all frontal views. |