FIGURE SUMMARY
Title

Zebrafish acvr2a and acvr2b exhibit distinct roles in craniofacial development

Authors
Albertson, R.C., Payne-Ferreira, T.L., Postlethwait, J., and Yelick, P.C.
Source
Full text @ Dev. Dyn.

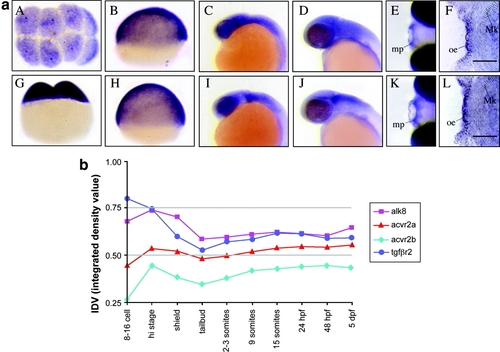
Developmental expression of transforming growth factor-beta (TGFβ) family member receptors. a: Whole-mount in situ hybridization (WISH) analysis of acvr2a (A-F) and acvr2b (G-L). Positive mRNA expression is indicated by purple color. A, E, and K are dorsal views; F and L are flat-mounted ventral views; the remaining panels are lateral views, with anterior to the left and dorsal to the top. Both acvr2a and acvr2b are expressed in early cleavage and epiboly stage embryos (A, B, and G, H, respectively). At 24 and 48 hours postfertilization (hpf), acvr2a expression is restricted to cranial neural tissues (C and D, respectively). At these stages, acvr2b exhibits a more discrete expression pattern, restricted to the midbrain-hindbrain boundary (mhb) and hindbrain (I and J). By 96 hpf, both acvr2 genes exhibit discrete expression in the maxillary processes (mp, E and K) and in the oral epithelium (oe, F and L). Mk, is Meckel′s cartilage. b: Densitometric analysis of reverse transcriptase-polymerase chain reaction (RT-PCR) analysis of acvr2a, acvr2b, alk8 and tgfbr2 gene expression. RT-PCR products specific for each receptor mRNA were generated at indicated developmental times, and size fractionated by gel electrophoresis. Integrated density values (IDV), the absolute sum of pixilated area of each RT-PCR product, were generated from digitally imaged ethidium bromide-stained RT-PCR product normalized to actin controls. Scale bar = 50 μm in F, L.

Characterization of acvr2a and acvr2b morphants (MOs). a: Acvr2 morphant cartilages, bones, and teeth. Alcian blue–stained cartilages appeared misshapen and/or missing in acvr2a and acvr2b MOs (B, G) compared with wild-type (wt) controls (L). Quercetin-stained acvr2a and acvr2b MOs revealed abnormal bone development (D and I, respectively) compared with wild-type sibling controls (N). Representative tooth phenotypes are shown (C, H, and M, teeth are outlined in black). The superimposition of bones and cartilages of acvr2a and acvr2b MO and wt embryos reveals distinct defects (E, J, and O, respectively). b: Rescue of morphant phenotypes with coinjected wild-type acvr2a and acvr2b mRNAs. The specificity of the morpholino oligomer phenotypes was confirmed by rescue with wild-type acvr2 mRNAs. Coinjection of wild-type acvr2a mRNA at 200 and 300 ng/μl resulted in rescue of 16% and 67%, respectively. The severity of the defects were classified 0–2, low to high. Coinjection of wild-type acvr2b mRNAs at 200 ng/μl resulted in the rescue of 71% of the acvr2b MO phenotype. Injection of wild-type acvr2b mRNAs at 300 ng/μl resulted in an acvr2b overexpression phenotype in greater than 50% of the injected embryos. Scale bars in a = 200 μm for craniofacial images, 50 μm for enlarged tooth images.

Molecular characterization of acvr2a and acvr2b morphants. All panels are dorsal views with anterior to the top. A: At the 12-somite stage, pax2a is expressed in the optic stalk (os), midbrain-hindbrain boundary (mhb), otic vesicle (ov), spinal cord neurons (scn), and in the pronephric duct (pd) in wild-type (wt) embryos. B: The acvr2a MOs exhibited reduced or absent pax2a expression in the optic stalk, midbrain-hindbrain boundary, and spinal cord neurons, whereas otic vesicle and pronephric duct tissues exhibited fairly normal pax2a expression. C: The acvr2b MOs exhibited slightly reduced pax2a expression in the optic stalk and midbrain-hindbrain boundary, whereas pax2a expression in otic vesicle, pronephric duct and spinal cord neurons appeared normal. D: At the 12-somite stage, krox20 is normally expressed in rhombomere 3 (r3) and rhombomere 5 (r5) and in cranial neural crest (CNC) cells migrating from r5. E,F: The acvr2a morphants exhibited mediolaterally expanded and disrupted krox20 expression (E), whereas acvr2b morphants exhibited mispatterned, chevron shaped neurepithelium (F). G: In 24 hours postfertilization (hpf) wt embryos, dlx2 is expressed in the CNC of four discrete pharyngeal arches (1-4). H: In contrast, acvr2a MOs exhibited reduced CNC populations and fused first and second, and third and fourth CNC segments. I: The acvr2b MOs exhibited wt dlx2 expression levels in first and second pharyngeal arches, whereas third and fourth segments exhibited reduced dlx2 expression and appeared fused.

The acvr2a and acvr2b genes mediate apoptosis. A–D: Dorsal views. E–H: Lateral views. Apoptotic cell populations were identified in 24 hours postfertilization acvr2a and acvr2b morpholino oligomer-injected embryos by terminal transferase-mediated dUT nick end-labeling (TUNEL) assay (C, G and D, H, respectively). The number of apoptotic cells in the midbrain and hindbrain of each of 10 wild-type, standard control injected, acvr2a and acvr2b MOs was estimated by counting TUNEL-labeled cells within the white boxed regions (A). I,J: A one-way analysis of variance was performed to quantify differences in apoptotic cell populations.

PHENOTYPE:
Fish:
Knockdown Reagents:
Observed In:
Stage: Prim-5

Unillustrated author statements

EXPRESSION / LABELING:
Genes:
Fish:
Anatomical Terms:
Stage: Day 4
PHENOTYPE:
Fish:
Knockdown Reagent:
Observed In:
Stage Range: Day 4 to Days 7-13
Acknowledgments
This image is the copyrighted work of the attributed author or publisher, and ZFIN has permission only to display this image to its users. Additional permissions should be obtained from the applicable author or publisher of the image. Full text @ Dev. Dyn.