
- Title
-
Characterization and expression pattern of zebrafish anti-Müllerian hormone (amh) relative to sox9a, sox9b, and cyp19a1a, during gonad development
- Authors
- Rodríguez-Marí, A., Yan, Y.L., Bremiller, R.A., Wilson, C., Cañestro, C., and Postlethwait, J.H.
- Source
- Full text @ Gene Expr. Patterns
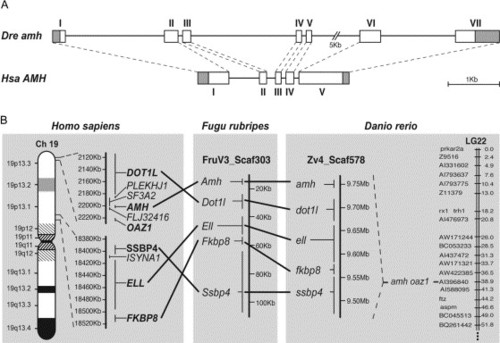
Genomic analysis of zebrafish amh. (A) Comparison of exon-intron organizations of zebrafish amh (Dre) and human AMH (Hsa) genes. Exons are represented by numbered boxes, and grey areas indicate untranslated regions. The correspondence of intron-exon boundaries between zebrafish and human genes is indicated by dashed lines. Scale bar is 1 kb. (B) Schematic representation of the conserved synteny in the amh genomic regions of human, fugu and zebrafish. The zebrafish amh gene is on genomic scaffold Zv4_Scaf578, which contains the four neighbor genes (dot1l, ell, fkbp8 and ssbp4), and maps to LG22 together with the oaz1 gene. All these genes are contained in a single genomic scaffold of Fugu (FruV3_Scaf303), and all of them map to human chromosome 19p13.3-1. |
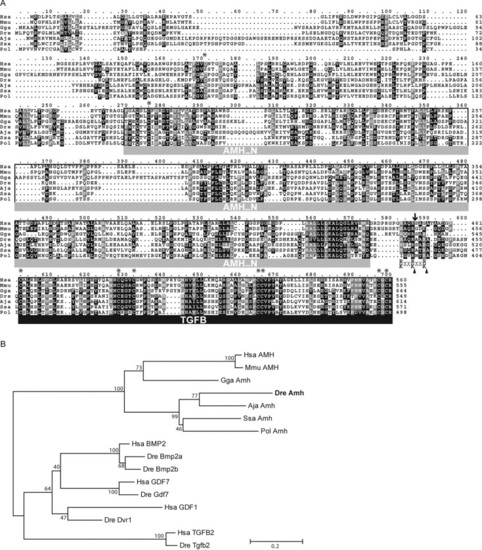
Comparative analysis of zebrafish Amh. (A) Protein alignment of zebrafish Amh with other related members of the Amh family. Conserved positions with the same amino acid (black) or similar residues (grey) in more than 70% of the sequences are shadowed. The TGF-beta domain at the C-terminus (TGFB in black under bar) and the AMH domain (AMH_N in grey under bar) that characterize this protein family are labeled. Putative consensus cleaving target sites (arrowheads in R/K-XX-R/K) and the cleavage site in the human AMH (arrow) by which the active TGF-beta domain is released are indicated. Each of the eight positions with conserved cysteines is labeled with an asterisk. (B) Protein sequence relationships between the Amh family and other protein families belonging to the TGF-beta superfamily are shown in a phylogenetic tree. The branch lengths are drawn to scale to the evolutionary distance based on Poison-corrected Neighbor-Joining method, and the numbers are the percentage of bootstrap values supporting each node from 500 replicas. Scale bar, 0.2 substitutions per site. Aja, Anguilla japonica (Japanese eel); Dre, Danio rerio (zebrafish); Gga, Gallus gallus (chicken); Hsa, Homo sapiens (human); Mmu, Mus musculus (mouse); Pol, Paralichthys olivaceus (Japanese flounder); Ssa, Salmo salar (Atlantic salmon). |

Expression pattern of amh during zebrafish gonad development. In situ hybridization was performed on sections of (A,B) undifferentiated gonads; (C,E,G,I) male gonads; (D,F,H,J) female gonads. (A) The earliest amh expression we observed was weakly detected transcript in 17 days post-fertilization (dpf) larvae. (B) Amh expression became more intense in the still undifferentiated gonads of 21 dpf larvae. (C,D) In 31 dpf juveniles, gonads were already differentiated into testes and ovaries. At this time, amh expression was detected only in testes (C) and was not detected in ovaries (D). (E,F) In 38 dpf larvae, as gonad development proceeded, amh maintained the same sexually dimorphic expression pattern. (G–J) In contrast to larval and juvenile stages, adults showed amh expression in both testes and ovaries. In males, amh expression was detected only in presumptive Sertoli cells (G). A higher magnification of a region expressing amh (dashed box) is shown in (I). In adult ovaries, amh expression differed among oocytes of different stages (IB, II, III) (H). Expression of amh was mostly detected in the monolayer of granulosa cells (gc) of Stage II oocytes (red arrowhead in H), but no expression of amh was detected in Theca cells (tc). Only reduced number of amh expressing cells could be detected in late stage IB oocytes (orange arrowhead) or early stage III oocytes (purple arrowhead), and no expression was detected in late stage III oocytes (green arrowhead). A higher magnification of a region expressing amh (dashed box) is shown in (J). Scale bars are indicated in each panel. ca, cortical alveoli; gc, granulosa cells; gv, germinal vesicle; o, ooplasm; tc, theca cells; y, yolk. Colored arrowheads label different stages of oocytes: orange, late stage IB; red, stage II; purple, early stage III; green, late stage III. EXPRESSION / LABELING:
|

Comparative analysis of the expression pattern of amh, sox9a, sox9b, cyp19a1a and sox8 during zebrafish gonad development. (A–C) undifferentiated gonads; (D–L) male gonads; (M–X) female gonads. To facilitate comparison among the expression patterns of amh (A,D,G,J,M,P,S,V), sox9a (B,E,H,K), sox9b (N,Q,T,W), cyp19a1a (C,F,I,L,O,R,U), and sox8 (X), in situ hybridization experiments were performed on adjacent sections. (A–C) The undifferentiated gonads of 17 day dpf larvae showed amh expression at low levels but already showed high expression of sox9a and cyp19a1a. (D–F) In 31 dpf juveniles, gonads had already differentiated. At this time in males, expression of amh and sox9a, but no cyp19a1a, was detected in testes. (G–L) As development of the gonads proceeded, the same expression pattern as in 31 dpf was maintained in later juvenile stages and adults, in which amh and sox9a expression could be observed in presumptive Sertoli cells, and cyp19a1a expression was not detected. (M–R) In gonads of 31 and 38 dpf female juveniles, no amh expression could be detected (M,P), sox9b was expressed at low levels in the ooplasm of some oocytes (N,Q) and cyp19a1a was expressed in cells surrounding the oocytes (O,R). (S–U) In adult female ovaries, amh expression was detected in granulosa cells of stage II oocytes (red arrowhead in S), but no expression was detected in early stage IB oocytes (yellow arrowhead in S) or late stage III oocytes (green arrowhead in S). Expression of sox9b was detected in the ooplasm of stage IB oocytes (yellow arrowhead in T) and stage II oocytes (red arrowhead in T) but no expression was detected in late stage III oocytes (green arrowhead in T). Regions in dashed boxes in (S) and (T) are shown in higher magnification in (V) and (W), respectively. Expression of cyp19a1a was not detected in early stage IB oocytes (yellow arrowhead in U), some granulosa cells were expressing cyp19a1a in late stage IB oocytes (orange arrowhead in U), most of the granulosa cells expressed cyp19a1a in stage II oocytes (red arrowhead in U), and maximum cyp19a1a expression was observed in late stage III oocytes (green arrowhead in U). (V–X) Comparison of amh, sox9b and sox8 expressions in stage II oocytes revealed that while amh was expressed in granulosa cells (gc) (V), sox9b and sox8 were expressed in the ooplasm (o) of oocytes (W,X). The main image in (X) is an enlargement of the boxed region of the inset, which shows a lower magnification of a complete view of a stage II oocyte. Roman numbers and letters indicate the stage of the oocytes according to (Selman et al., 1993). Scale bars: 20 μm (A–C as in A), 50 μm (D–L as in D), 50 μm (M–U as in M), 20 μm (V–X as in V). Colored arrowheads label different stages of oocytes: yellow, early stage IB; orange, late stage IB; red, stage II; green, late stage III. EXPRESSION / LABELING:
|

Unillustrated author statements |
Reprinted from Gene expression patterns : GEP, 5(5), Rodríguez-Marí, A., Yan, Y.L., Bremiller, R.A., Wilson, C., Cañestro, C., and Postlethwait, J.H., Characterization and expression pattern of zebrafish anti-Müllerian hormone (amh) relative to sox9a, sox9b, and cyp19a1a, during gonad development, 655-667, Copyright (2005) with permission from Elsevier. Full text @ Gene Expr. Patterns