
- Title
-
Mutually exclusive glomerular innervation by two distinct types of olfactory sensory neurons revealed in transgenic zebrafish
- Authors
- Sato, Y., Miyasaka, N., and Yoshihara, Y.
- Source
- Full text @ J. Neurosci.

Two distinct types of OSNs with different molecular signatures in zebrafish OE. A-J, RNA in situ hybridization was performed on horizontal sections of the zebrafish olfactory rosette using digoxigenin-labeled probes specific for the following molecules: zOMP (A, B), zCNGA2 (C), zOR2.1 (D), zOR13.1 (E), zTRPC2 (F, G), zVR5.3 (H), zVR3.13a (I), and zVR3.13b (J). Note that zOMP (B), zCNGA2 (C), and OR-type receptors (D, E) were expressed in the deep layer of the OE, whereas zTRPC2 (G) and VR-type receptors (H-J) were expressed in the superficial layer. In contrast to the zVR5.3 expression in a large fraction of OSNs (H), other VR- and OR-type receptors were expressed in a small subset of OSNs (D, E, I, J). B-E, G-J, The apical surface of the OE is at the top of each panel. Scale bars: (in F) A, F, 100 μm; (in J) B-E, G-J, 20 μm. EXPRESSION / LABELING:
|
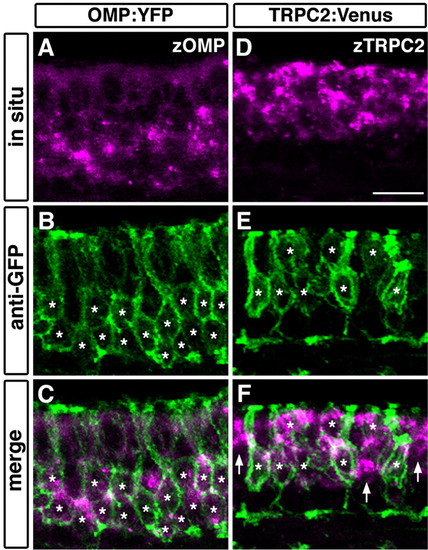
Double fluorescent labeling of transgene products and endogenous mRNA in the OE of OMP:YFP and TRPC2:Venus transgenic fish.A-C, The expression of zOMP mRNA (magenta; A, C) and YFP protein (green; B, C) in the OMP:YFP line. D-F, The expression of zTRPC2 mRNA (magenta; D, F) and Venus protein (green; E, F) in the TRPC2:Venus line. All photographs represent stacked images of optical sections. Asterisks denote the position of somata labeled with anti-GFP. In the OMP:YFP line, YFP was expressed in cells that express zOMP mRNA in the deep layer of the OE (asterisks; B, C). In the TRPC2:Venus line, Venus was expressed in zTRPC2-positive cells in the superficial layer (asterisks; E, F). However, some zTRPC2-positive cells appeared to be unlabeled (arrows; F). The apical surface of the OE is at the top. Scale bar, 50 μm. |

S100-positive crypt OSNs were not labeled in either OMP:YFP or TRPC2:Venus transgenic fish. OE sections of two transgenic fish, OMP:YFP (A-D) and TRPC2:Venus (E-H), were immunostained with antibodies against S100 (A, C, E, G; magenta in B, D, F, H) and GFP (green in B, D, F, H). Two representative crypt OSNs are shown for each transgenic line (arrowheads; A-H). All photographs represent single optical sections. The apical surface of the OE is at the top. Scale bar, 50 μm. |
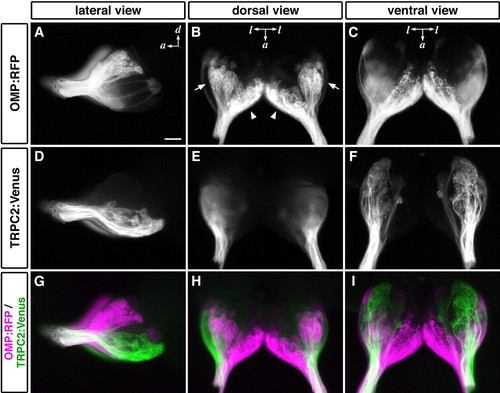
Differential axonal projections from two types of OSNs. Whole-mount OB from OMP:RFP;TRPC2:Venus adult zebrafish were observed under a fluorescence stereomicroscope: A, D, G, lateral views; B, E, H, dorsal views; C, F, I, ventral views. Ciliated OSNs labeled with RFP projected their axons to almost all over the dorsal region and the ventromedial portion of the OB (A-C; magenta in G-I). In contrast, microvillous OSNs labeled with Venus projected their axons exclusively to the ventrolateral region (D-F; green in G-I). The arrows and arrowheads indicate dorsal cluster and the anterior plexus, respectively. a, Anterior; d, dorsal; l, lateral. Scale bar, 100 μm. |

Mutually exclusive glomerular innervation by two types of OSNs. Horizontal sections through the OB of OMP:RFP; TRPC2:Venus adult zebrafish were stained with anti-RFP, anti-GFP, and anti-SV2 antibodies. A-H, Merged images of staining for RFP (green) and SV2 (magenta). I-P, Merged images of staining for Venus (green) and SV2 (magenta). Q-X, Merged images of staining for RFP (magenta) and Venus (green). The alternate eight sections from a series of OB sections are ordered from the dorsalmost (top) to the ventralmost (bottom) section. All photographs represent stacked images of optical sections. Arrows indicate glomeruli that were not labeled with either RFP or Venus. Numbers for single glomeruli or glomerular subgroup: 1, dorsal cluster; 2, dorsal cluster-associated glomeruli; 3, mediodorsal posterior glomeruli; 4, anterior plexus; 5, medial glomeruli; 6, medioventral posterior glomerulus; 7, ventromedial glomeruli; 8, lateroposterior glomerulus; 9, lateral chain; 10, ventrolateral glomeruli. Posterior is at the top of each panel. a, Anterior; l, lateral. Scale bar, 100 μm. |

Establishment of the segregated axonal terminations at early stages of development. Time-lapse imaging of labeled OSNs in living OMP:CFP;TRPC2:Venus zebrafish embryos was performed. CFP-labeled (A-E; magenta in K-O) and Venus-labeled OSNs (F-J; green in K-O) in a single representative embryo are shown. All photographs represent stacked images of optical sections. Axonal terminations from CFP-labeled and Venus-labeled OSNs were already segregated at 2 dpf (K) and maintained through development (L, 3 dpf; M, 5 dpf; N, O, 7 dpf). A-D, F-I, K-N, Frontal views; E, J, O, dorsal views. l, Lateral; d, dorsal; v, ventral; p, posterior; a, anterior. Scale bar, 50 μm. |