
- Title
-
15-Zinc finger protein Bloody Fingers is required for zebrafish morphogenetic movements during neurulation
- Authors
- Sumanas, S., Zhang, B., Dai, R., and Lin, S.
- Source
- Full text @ Dev. Biol.

Analysis of the blf expression pattern. (A) Northern blotting analysis of blf expression. A single blf-specific band of ∼2.4 kb size is observed from the sphere stage onwards. Maximum expression is observed at the sphere and 45% epiboly stages. 28S and 18S rRNA bands are indicated. (B–M) In situ hybridization analysis of blf expression. Anterior is to the left except where indicated. (B) 50% epiboly stage, animal view. blf expression appears uniform and ubiquitous within the blastoderm. (C, D) 80% epiboly stage, (C) vegetal view, (D) lateral view. blf is expressed within the posterior hypoblast and excluded from the dorsalmost cells (arrow, C). d, dorsal; v, ventral; yp, yolk plug. (E) 1-somite stage, dorso-posterior view. blf is localized to the posterior dorsal paraxial and lateral mesoderm and excluded from the axial mesoderm. Expression extends into the ventral region close to the tailbud (tb). a, anterior, p, posterior. (F) 3-somite stage, flat mount. blf is expressed in a semicircular pattern around the tailbud region (tb) in the dorsal paraxial and lateral mesoderm. a, anterior, p, posterior. (G, H) 10-somite stage. blf is expressed in two stripes of the putative hematopoietic progenitor cells in ventrolateral mesoderm (arrows). (I) 18-somite stage, the tail region. blf is localized to two stripes within the hematopoietic region of ventrolateral mesoderm. (J) 15-somite stage. blf is expressed in the presumptive hematopoietic cells in ventrolateral posterior mesoderm. (K, L) 22 hpf stage. blf is localized to the intermediate cell mass (ICM) region, where the primitive hematopoiesis is known to take place. (M) 26 hpf stage. blf is expressed in the ICM region (arrowhead) and circulating blood cells (arrows). |

Analysis of blf expression in hematopoietic mutants at 22 hpf. (A, B) cloche (clom39) homozygous embryos have lost blf expression. (A) ∼3/4 of progeny from heterozygous clo carriers display blf expression in the ICM region (arrow) while (B) ∼1/4 of embryos have very few or none blf-expressing cells. (C, D) moonshine (montu244b) homozygous embryos defective in TIF1γ transcription factor have lost blf expression. (C) <∼3/4 of progeny from heterozygous mon carriers display blf expression in the ICM region (arrow) while (D) ∼1/4 of embryos have very few or none blf-expressing cells. (E) blf expression is not affected in the progeny from the vlad tepes (vtm651) carriers defective in the gata1 transcription factor. EXPRESSION / LABELING:
|

Morphological analysis of blf morphants at the 22-somite stage. Blf MOs caused a minor general developmental delay; therefore, all embryos were staged individually by the standard staging criteria (Kimmel et al., 1995). (A, D) Control uninjected embryo, (B, E) 7.5 ng blf MO1-injected embryo, (C, F) 1.5 ng blf MO2-injected embryo, (H) 2ng blf MO2-injected embryo. Note the notochord and floorplate undulations (arrows), delaminating dorsal ectodermal cells (arrowheads) and the severely shortened axis in blf MO-injected embryos. (G) Percentage of blf MO-injected embryos displaying axial undulations and delaminating ectodermal cells. Embryos injected with a control 5-base mismatch blf-MO2 were completely normal (not shown). blf-MO3 also caused axial undulations, albeit at lower frequency (not shown). |

In situ hybridization analysis of axial markers in blf morphants, injected with 2 ng of MO2. Anterior is to the left in all panels. (A, B) Notochord marked by no tail (ntl) expression at the 10-somite stage. Note the shortened, thickened, and undulating notochord in blf morphants (B), compared with control uninjected embryos (A). (C, D) Sonic hedgehog (shh) marks the notochord (n) and the floorplate (fp) at the 22-somite stage. Note the undulating notochord and floorplate in blf morphants (D), compared with control uninjected embryos (C). (E, F) myod expression marks paraxial somitic mesoderm at the 10-somite stage. Note wider and compressed somites as well as undulations in adaxial stripes of myod-expressing cells in blf morphants (F), compared with control uninjected embryos (E). (G, H) Expression of spondin1b (spon1b) marks the floorplate at the 22-somite stage. Note severe undulations (arrows) and delaminating cells (arrowhead) in blf morphants (H), compared to uninjected control embryos (G). Inset, high-magnification dorsal view of the floorplate. Note the wider and disorganized floorplate in the inset (H). A cluster of spon1b-expressing cells failed to converge to the midline (arrowhead, inset in H). (I, J) Expression of the forkhead family transcription factor foxA1 (fkd7) marks the floorplate (fp), the hypochord (hc), and endoderm at 24 hpf. Note undulations of the floorplate and the hypochord in blf morphants (J), compared with uninjected controls (I). EXPRESSION / LABELING:
|
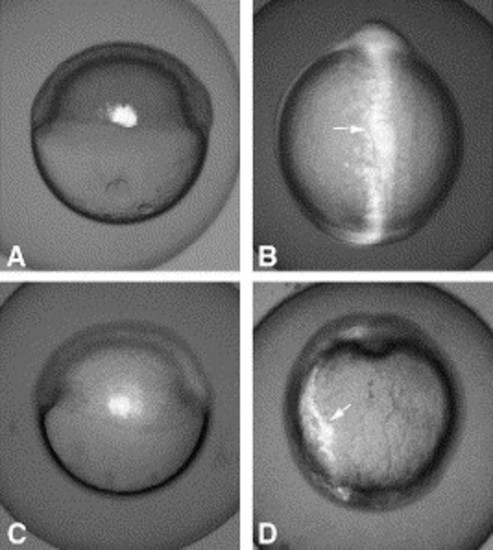
Analysis of convergence in wt (A, B) and blf morphants (C, D) by uncaging DMNB-caged fluorescein-dextran in a group of cells within lateral mesendoderm. (A, C) A group of cells within lateral mesendoderm is labeled by the UV-photoactivation at the shield stage. Lateral view, dorsal is to the right. (B, D) The same embryo as in panels (A) or (C) at the 2-somite stage. Note that the labeled cells (arrows) have converged to the midline in the control (B) but not in the morphant embryo (D). Dorsal view, anterior is up. |
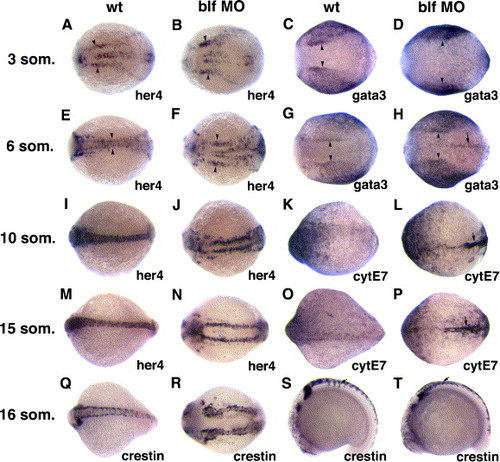
In situ hybridization analysis of neural and ectodermal markers in blf morphants, injected with 2 ng of MO2. Dorsal view, anterior is to the left, except where noted. (A, B, E, F) Hairy-related transcription factor her4 labels a subset of neural cells at the 3-somite (A, B) and 6-somite (E, F) stages. Note the expanded neural plate (arrowheads) in blf morphants (B, F), compared with uninjected control embryos (A, E). (C, D, G, H) GATA-family transcription factor gata3 labels non-neural ectoderm at the 3-somite (C, D) and 6-somite (G, H) stages. Note that the gap in gata3 expression which corresponds to the neural plate (arrowheads), is wider in blf morphants (D, H), compared with uninjected control embryos (C, G). Additional gata3-expressing cells are observed at the midline of blf morphants (arrow, H). (I, J, M, N) Her4 expression labels neural tube at the 10-somite (I, J) and 15-somite (M, N) stages. Note the bilaterally split neural tube in blf morphants (J, N), compared with uninjected control embryos (I, M). (K, L, O, P) Cytokeratin E7 expression labels epidermal cells at the 10-somite (K, L) and 15-somite (O, P) stages. Note the strong enrichment in cytokeratin expression in the delaminating cells of dorsal posterior ectoderm in blf morphants (arrows in L, P), compared with uninjected control embryos (K, O). (Q, R) Crestin expression labels neural crest cells at the 16-somite stage. Note two bilateral stripes of neural crest cells in blf morphants (R) compared with the single stripe in control uninjected embryos (Q). (S, T) Crestin expression, 16-somite stage. Note the absence of the intersomitic bands of migrating neural crest cells (arrow) in blf morphants (T), compared with uninjected control embryos (S). EXPRESSION / LABELING:
|

Unillustrated author statements |
Reprinted from Developmental Biology, 283(1), Sumanas, S., Zhang, B., Dai, R., and Lin, S., 15-Zinc finger protein Bloody Fingers is required for zebrafish morphogenetic movements during neurulation, 85-96, Copyright (2005) with permission from Elsevier. Full text @ Dev. Biol.