
- Title
-
Chordin, FGF signaling, and mesodermal factors cooperate in zebrafish neural induction
- Authors
- Londin, E.R., Niemiec, J., and Sirotkin, H.I.
- Source
- Full text @ Dev. Biol.
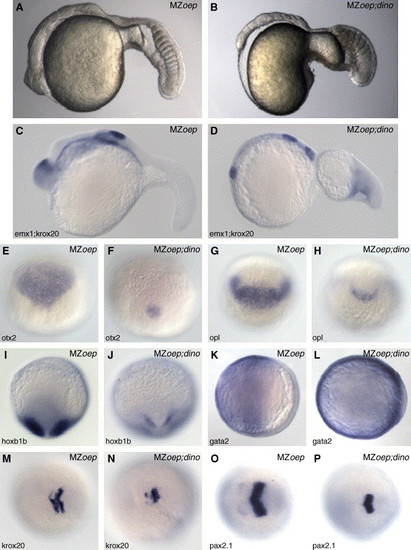
Neural tissue is maintained in MZoep;dino double mutants. Lateral views of living MZoep and MZoep;dino double mutants (A and B) at 22 h. The double mutant has reduced neural tissue and large tail somites compared to MZoep single mutants. Analysis of the expression patterns of neural and presumptive epidermal markers in MZoep and MZoep;dino double mutants by whole mount RNA in situ hybridization. The presence of neural tissue at 22 h is confirmed by the expression of emx1 and krox20 (C and D). The expression domains of the anterior neural markers otx2 and opl and the posterior neural marker hoxb1b are reduced in MZoep;dino double mutants (F, H, and J) compared to MZoep mutants (E, G, and I). The gata2 expression domain is expanded dorsally in MZoep;dino double mutants (K and L). During early somitogenesis, the neural plate is narrow in the double mutant as revealed by krox20 and pax2.1 expression (M–P). Panels C and D are lateral views; E–H are dorsal views at 70% epiboly (mid-gastrula); I and J are dorsal views at late gastrula (90% epiboly); K and L are animal pole views at 70% epiboly (mid-gastrula); and M–P are dorsal views at the three-somite stage. Genotypes of all embryos were determined following photography by PCR-based analysis. EXPRESSION / LABELING:
|

The mesoderm is not required for neural induction. Lateral views of live MZoep and MZoep;ntl double mutant embryos (A and B). The double mutant lacks tail somites but forms anterior neural tissue. The double mutant phenotype can be phenocopied by microinjection of ntl morpholinos into MZoep mutants (C and D). Analysis of the expression patterns of neural and mesodermal markers in MZoep and MZoep;ntl double mutants by whole mount RNA in situ hybridization. At 24 h, expression of emx1 and krox20 is indistinguishable in MZoep (E) and MZoep;ntl double mutant embryos (F). While MZoep mutants express markers of tail mesoderm including papc, α-tropomyosin, spt, and tbx6 (G, I, K, and M), these markers are all absent in MZoep;ntl double mutant embryos (H, J, L, and N). Early expression of otx2 during gastrulation is unaffected in MZoep;ntl double mutant embryos (P) compared to MZoep single mutants (O). The small otx2 domain in MZoep;dino embryos is not altered by treatment with ntl morpholinos (Q and R). A–F, 24-h embryos; G and H, lateral views of tails of 23 h, or, I and J, 24-h embryos; K and L, dorsal views of two-somite embryos, anterior is toward the top; M and N, lateral views of two-somite embryos; and O–R, dorsal views of mid-gastrula embryos (70% epiboly). Genotypes of all embryos were determined following photography by PCR-based analysis. EXPRESSION / LABELING:
|

XFD blocks neural induction in MZoep mutants and wild-type embryos. Analysis of the expression patterns of ectodermal markers in control and XFD-injected MZoep mutant embryos. Lateral views of 24-h live control-injected wild type (A) and MZoep mutant (C) embryos and XFD-injected wild type (B) and MZoep (D) embryos. XFD overexpression results in posterior defects in wild-type embryos but anterior neural deficits are apparent in XFD-injected MZoep mutant embryos. Whole mount RNA in situ hybridization anterior neural and ectodermal markers in MZoep and wild-type control (E, G, I, K, M, and O) and XFD (F, H, J, L, N, and P) injected MZoep mutant embryos and wild-type embryos at mid-gastrula (70% epiboly). The expression domains of the anterior neural markers otx2 (E, F, G, and H) and opl (I, J, K, and L) are shifted toward the margin and dramatically reduced in XFD-injected embryos. The expression domains of gata2 (M, N, O, and P) in the ventral ectoderm in XFD-treated embryos are expanded compared to control-injected embryos. For all microinjection experiments, 125 pg of XFD mRNA was injected. The consequence of XFD treatment on transcript levels of markers of neural tissue and presumptive epidermis in MZoep mutants and wild-type embryos was monitored by real-time PCR (Q and R). The levels of neural markers otx2 and hoxb1b are decreased in embryos microinjected with 125 pg XFD mRNA, while the levels of presumptive epidermal markers gata2 and gata3 are increased. The fold change (y-axis) of these markers is set relative to control (GFP)-injected embryos. Embryos were collected at mid-gastrulation (70% epiboly). EXPRESSION / LABELING:
|

Recovery of anterior neural tissue following FGF inhibition depends on Nodal signaling. (A–H) otx2 in situ hybridization of wild type, MZoep, and MZoep; dino embryos microinjected with 125 pg XFD or GFP mRNA. Expression of otx2 is comparable at the six-somite stage in wild-type embryo microinjected with GFP or XFD mRNA (A and B), while XFD-injected MZoep embryos have a reduced otx2 domain (C and D). The otx2 domain is comparable in XFD- and GFP-injected MZoep;dino mutant embryos at the six-somite stage (E and F), while otx2 expression is eliminated in XFD-injected MZoep; dino embryos at 70% epiboly (mid-gastrula) (G and H). Stages of embryos are indicated. Panels A–F are lateral views, G and H are dorsal views. (I) Real-time PCR analysis of otx2 transcript levels in wild type and MZoep XFD-injected embryos at the six-somite stage. The fold change (y-axis) of these markers is set relative to control (GFP)-injected embryos. XFD-injected MZoep embryos show a decrease in otx2 expression while XFD-injected wild-type embryos show no change in otx2 expression compared to controls. EXPRESSION / LABELING:
|

FGF signaling represses BMP transcription. Real-time PCR analysis of XFD (A and B) and Δ-FGFR-4 (C and D)-microinjected wild-type embryos during late blastula and early gastrula stages. The fold change (y-axis) of the markers bmp2, bmp4, and bmp7 is set relative to control (GFP)-injected embryos. XFD- and Δ-FGFR-4-injected embryos show an increase BMP transcript levels during late blastula stages. (E–H) RNA in situ hybridization of bmp2 expression in control (E and F)- and XFD-injected wild-type embryos (G and H). In XFD-injected embryos, the bmp2 expression domain extends into the dorsal ectoderm. Panels E and G are lateral views of shield stage embryos and F and H are animal pole views of the same embryos. |

FGF signaling is required during the late blastula period to regulate BMP transcription. Embryos were injected with iFGFR-1 and activated with AP20187 at the 512-cell stage. Embryos were collected at early and mid-gastrula stages for real-time PCR. Embryos at early gastrulation (shield stage) (A) were tested for their fold change (y-axis) of bmp2, bmp4, and bmp7 (A), and for their expression of otx2, hoxb1b, and gata2 (B) at mid-gastrulation (70% epiboly). Activating FGF signaling at the 512 cell stage results in an early decrease in bmp2, bmp4, and bmp7 expression at shield stage. At mid-gastrulation, these embryos have increases in otx2 and hoxb1b transcript levels and a decrease in gata2 levels. (C) FGF signaling was inhibited with the pharmacological drug SU5402 at 8-cell, 128-cell, 512-cell, early blastula, and late blastula, and collected at shield stage (early gastrula) for real-time PCR analysis. Graphed is the fold change (y-axis) for bmp2, bmp4, and bmp7 levels relative to control-treated embryos. These results show that the effectiveness of the SU5402 treatment in blocking repression of BMP transcript levels diminishes between the 512-cell and early blastula (sphere stages). (D) FGF signaling was either inhibited or activated with SU5402 or AP20187 at the 512-cell stage. Embryos were collected at the shield stage (early gastrula) for their fold change (y-axis) of vox and eve1. Activating FGF signaling results in a 25% and 50% reduction in transcript levels for vox and eve1, while inhibiting FGF results in a 30% and 50% increase in vox and eve1 transcript levels. These results show that inhibiting or activating FGF at the 512-cell stage results in loss of BMP target expression. EXPRESSION / LABELING:
|

FGF regulates chordin expression but does not require Chordin to repress BMP transcript levels. Addition of AP20187 to iFGFR-1-injected embryos induces chordin expression (B) throughout the embryo while in the absence of AP20187 iFGFR-1 embryos maintain wild-type levels of chordin (A) at shield stage (early gastrula). Microinjection of 125 pg XFD mRNA has the opposite effect and dramatically reduces chordin expression at shield stage (D) compared to control-injected embryos (C). Whole mount RNA in situ hybridization of embryos from a dino heterozygote intercross (E–L). bmp2 expression at shield stage in iFGFR-1-injected embryos (E–H) exposed to AP20187 (G and H) or embryo water (E and F). The dino mutation does not suppress the activity of iFGFR-1 to repress bmp transcript levels. Genotypes of embryos are indicated. (I–L) bmp4 expression at shield stage in control (I and J) or embryos injected with 50 pg fgf3 mRNA-injected embryos (K and L). All views are animal pole. Genotypes of embryos were determined by PCR-based genotyping following photography. To determine if chordin has an effect on BMP transcript levels, real-time PCR was performed on embryos injected with 100 pg chordin and collected at 30% epiboly (M). Graphed is the fold change (y-axis) for bmp2, bmp4 and bmp7 levels relative to control injected embryos. These results show that chordin overexpression does not impact BMP transcript levels during the blastula period. |
Reprinted from Developmental Biology, 279(1), Londin, E.R., Niemiec, J., and Sirotkin, H.I., Chordin, FGF signaling, and mesodermal factors cooperate in zebrafish neural induction, 1-19, Copyright (2005) with permission from Elsevier. Full text @ Dev. Biol.