
- Title
-
Essential roles of a zebrafish prdm1/blimp1 homolog in embryo patterning and organogenesis
- Authors
- Wilm, T.P., and Solnica-Krezel, L.
- Source
- Full text @ Development

Expression of prdm1 during embryogenesis. (A-C,F-H) Lateral view, dorsal to the right. (K-N) Lateral view, anterior to the left. (D,I) Animal view, dorsal to the bottom. (E,J) Flat mounts, anterior to the left. (C,D,H,I) Different views of same embryo. (D) Different focal plane in box. (A,B) prdm1 expression in YSL (arrows) and prechordal plate shortly before and after onset of gastrulation, compared with gsc expression (F,G). (C,D) prdm1 expression in prechordal plate, at the boundary of non-neural and neural ectoderm and slow muscle precursors (adaxial cells) at the end of gastrulation, compared with hgg1 and dlx3b expression (H,I). (E) New prdm1 expression in branchial/gill arch progenitors and otic vesicle at 14 hpf. (J) prdm1 expression in slow twitching myoblasts and unidentified neuronal cells; trunk and tail are shown. (K) New prdm1 expression at 24 hpf in pectoral fin buds, dorsal and ventral fin folds and the cloaca; maintained expression in the hatching gland. (L,M) New prdm1 expression in the photoreceptor cell layer at 2 dpf. (N) New prdm1 expression in lateral line organ. Scale bar: 200 µm. ac, adaxial cells; ba, branchial arch progenitors; cl, cloaca; fb, fin buds; ff, fin folds; ga, gill arches; hg, hatching gland; ll, lateral line organ; nc, neuronal cells; ne, neural ectoderm; nne, non-neural ectoderm; ov, otic vesicle; pf, pectoral fin; pl, photoreceptor cell layer; pp, prechordal plate; sm, slow twitching myoblasts.
EXPRESSION / LABELING:
|

Placing prdm1 in genetic hierarchies. (A-D) Lateral view, dorsal to the right. (E,F) Dorsal view, anterior to the top. (H-K) Animal view, dorsal to the bottom. (L,M) Vegetal view, dorsal to the top. (G,N) Lateral view of trunk-tail junction, anterior to the left. (A,H;B,I;C,J;D,K) Different views of same embryo. (H,I) Different focal plane in box. (A,H,E,L,G) Normal prdm1 expression at the conclusion of gastrulation, at early somitogenesis and at 24 hpf; compare Fig. 2 for details. prdm1 expression in boz (B,I), MZoep (C,J), swr (D,K), din (F), smu (M) and cas (N) mutants. For details see text. Scale bar: 200 µm in A; 50 µm in G.
EXPRESSION / LABELING:
|

prdm1 misexpression phenotype. (A-D) Lateral view, anterior to the left. (E,F) Dorsal view, anterior to the top. (G,H,M,N,S,T) Lateral view, dorsal to the right. (I-L,O,P) Animal view, dorsal to the right. (Q,R) Animal view, dorsal to the bottom. (S,T) Dorsal view, animal to the top. (A,E,G,I,K,M,O,Q,S) Untreated controls (ctrl). (B-D,F,H,J,L,N,P,R,T) Embryos microinjected with synthetic prdm1 RNA (Prdm1). (A-D) Overall morphology at 1 dpf. (E,F) six3b, pax2a, krox20 expression in the developing brain at early somitogenesis; somitic dlc expression for staging purposes. (G,H) boz; (I,J) gsc; (K,L) chd; (M,N) szl; and (O,P) bmp4 expression. (Q,R) hgg1 and dlx3b expression at the start of somitogenesis. (S) six3b, pax2a, krox20 expression in untreated and (T) prdm1-injected boz embryos with low phenotypic penetrance and expressivity. (U) prdm1-misexpression causes increased penetrance and expressivity of the boz phenotype monitored by reduction of six3b expression; independent females (#1-3). For details see text. Scale bars: 200 µm. d, dorsal; pp, prechordal plate. Animal pole highlighted by a star.
EXPRESSION / LABELING:
|
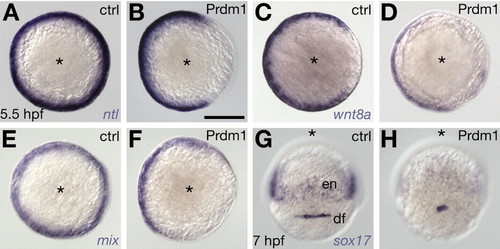
Effects of prdm1 misexpression on mesendoderm formation. (A-F) Animal view, dorsal to the right. (G,H) Dorsal view, animal to the top. (A,C,E,G) Untreated controls (ctrl). (B,D,F,H) Embryos microinjected with 100 pg of synthetic prdm1 mRNA (Prdm1). (A,B) ntl expression in mesoderm. (C,D) wnt8a expression in mesoderm. (E,F) mix expression in endoderm. (G,H) sox17 expression in endoderm and dorsal forerunner cells. Scale bar: 200 µm (B). df, dorsal forerunner cells; en, endoderm.
EXPRESSION / LABELING:
|
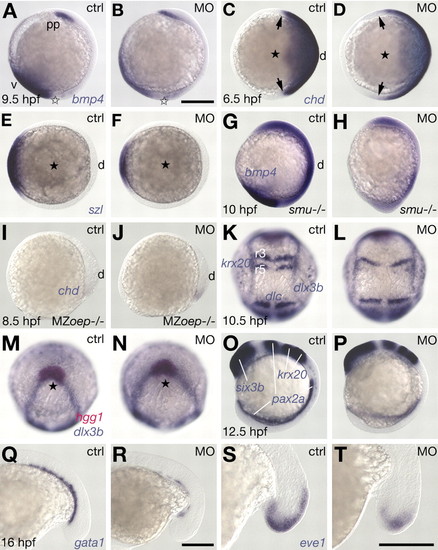
MO-induced interference with Prdm1 activity affects DV patterning. (A,B,G-J,O,P) Lateral view, dorsal to the right. (C-F) Animal view, dorsal to the right. (K,L) Dorsal view, anterior to the top. (M,N) Animal view, dorsal to the bottom. (K,M;L,N) different views of same embryos. (Q-T) Lateral views, anterior to the left; tailbud region is shown. (A,C,E,G,I,K,M,O,Q,S) Untreated controls (ctrl). (B,D,F,H,J,L,N,P) Embryos microinjected with 2 ng of MOprdm1 (MO). (R,T) Embryos microinjected with 1 ng of MOprdm1. (A,B) bmp4 expression. (C,D) chd expression, domain boundaries highlighted (arrows). (E,F) szl expression. (G,H) Reduced ventral expression of bmp4 in morphant smu embryos; lack of ptc1 expression identifies smu mutants (not shown). (I,J) Increased dorsal chd expression in MZoep mutant embryos. (K,L) Mediolateral expansion of forming neural and somitic tissues as revealed by expression of krox20, dlx3b and dlc. (M,N) Formation of the prechordal plate was not altered in morphants. (O,P) AP neural patterning, revealed by six3b, pax2a and krox20 expression. (Q,R) Ventroposterior expression of gata1 in blood precursors. (S,T) Expression of eve1 in ventroposterior cells in the tail tip at midsegmentation. Scale bar: 200 µm. d, dorsal; r3/rS, rhombomeres 3 and 5; v, ventral. Animal pole highlighted by a black star. The vegetal pole is highlighted by a white star.
EXPRESSION / LABELING:
PHENOTYPE:
|

Early loss-of-function phenotype after MO-mediated interference with Prdm1 activity. (A-E) Ventral view, anterior to the left; tail region is shown. (F-I,N-Q,U-X) Lateral view, dorsal to the right. (J-M) Animal view, dorsal to the bottom. (R,S) Dorsal view, anterior to the top; somitic region is shown. (F,J;G,K;H,L;I,M) Different views of same embryo. (A,B,D,F,H,J,L,N,P,R,U,W) Untreated controls (ctrl). (C,E) Embryos microinjected with 1 ng of MOprdm1 (MO). (G,I,K,M,O,Q,S,V,X) Embryos microinjected with 2 ng of MOprdm1. (A) Wild-type tail. (B,C) Interference with Prdm1 function partially suppressed duplicated fin fold phenotype in ogo mutant embryos. (D,E) Similar experiment in din mutant embryos did not show this effect. (F-I) bmp4 expression was reduced after injection of MOprdm1 in ogo but not din mutants. (J-M) Anterior neural ectoderm was expanded mediolaterally in ogo but not din mutants injected with MOprdm1 (white arrows) compared with untreated siblings (white open arrows). (N,O) Animal-vegetally elongated morphology of morphant embryos compared with control siblings at the end of gastrulation; dimensions measured are indicated, embryonic length (yellow), dorsal mesoderm extension (green), animal-vegetal axis (red), mediolateral axis (blue). (P,Q) Animal-vegetal elongation of morphant embryonic axis persisted throughout early segmentation. (R,S) Forming somites were mediolaterally expanded. (T) Schematic overview of photoactivation of caged lineage tracer dye, dorsal at the embryonic shield and ventral at the blastoderm margin. (U,V) Tracking of dorsally photoactivated lineage tracer (between green arrows) at the end of gastrulation. (W,X) Tracking movements of ventrally photoactivated lineage tracer (between green arrows) at the end of gastrulation. Scale bars: 150 µm in B,D; 200 µm in G,U; 100 µm in R. av, animal-vegetal axis; bm, blastoderm margin; d, dorsal; dm, dorsal mesoderm extension; el, embryonic length; es, embryonic shield; ml, mediolateral axis; s5, fifth somite; v, ventral; vm, ventralmost mesoderm; ye, yolk extension.
EXPRESSION / LABELING:
PHENOTYPE:
|

Effects of interference with Prdm1 activity on embryonic morphology, slow muscle and pectoral fins. (A-C,F-M) Lateral view, anterior towards the right. (D,E) Frontal view, dorsal towards the top. (N,O) Dorsal view, anterior towards the top, left side shown. (A,D,F,H,J,L,N) Untreated controls (ctrl). (B,C,E,G,I,K,M,O) Embryos microinjected with 1 ng of MOprdm1 oligonucleotides (MO). (A-C) Overall morphology at 24 hpf; embryo in B scored as strong phenotype with kinked tail (kt); embryo in C scored as severe phenotype exhibiting degeneration in head and trunk (dg; embryos of that class were not subjected to molecular anlyses). (D,E) Head morphology at 24 hpf. (F,G) Morphology of three somitic segments at 24 hpf; somites are U-shaped and lack horizontal myoseptum (hm, broken line) in morphants morphants as seen in ubotp39 mutant embryo. (H,I) emx1 expression in diencephalon (de) (Morita et al., 1995), but not krox20 expression in hindbrain rhombomeres 3 and 5 (r3, r5), is slightly reduced at 24 hpf. (J,K) eng2a expression at the mid/hindbrain boundary (mhb) (Ekker et al., 1992) is normal and reduced in muscle pioneers (mp) in 18 hpf morphants. tbx5 expression in prospective pectoral fin buds is missing (fb) (Begemann and and Ingham, 2000). (L,M) Slow muscle fiber formation, detected by a-sMHC antibody (mAB F59) (Crow and Stockdale, 1986), is severely affected in morphants (white arrows), as observed in ubotp39 mutant embryo (Baxendale et al., 2004), and the level of sMHC protein expression is low (image overexposed); broken line highlights somite boundaries; Cy2-conjugated secondary antibodies by Jackson ImmunoResearch were used, photographed using a Zeiss LSM510 inverted confocal laser scanning microscope. Seventy-five percent of morphants (n=51) displayed 0-50% of labeled slow muscle fibres compared with 17% (n=60) when co-injected with 50 pg of prdm1mut RNA. (N,O) Loss of pectoral fins (pf) and failure of swim bladder (sb) inflation. Scale bar: 200 µm in A,I,P,Q,T; 100 µm in D,O; 50 µm in F,M. EXPRESSION / LABELING:
|
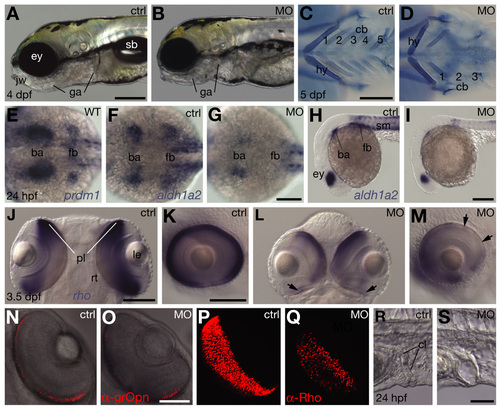
Additional organogenesis defects resulting from downregulation of Prdm1 activity in branchial arches, eyes and cloaca. (A,B,H,I,K,M,R,S) Lateral view, anterior towards the left. (C,D) Ventral view, anterior towards the left. (E-G) Dorsal view, anterior towards the left. (J) Dorsal view, anterior towards the top. (L) Ventral view, anterior towards the top. (N-Q) Ventral view, anterior towards top right, left eye. (J,K and L,M) Different views of the same embryos. (A,C,E,F,H,J,K,N,P,R) Untreated controls (ctrl). (B,D,G,I,L,M,O,Q,S) Embryos microinjected with 1 ng of MOprdm1 oligonucleotides (MO). (A,B) Morphants exhibit jaw (jw) and gill arch defects (ga), and lack inflated swim bladders (sb); eye (ey). (C,D) Development of pharyngeal skeleton, visualized by Alcian Blue cartilage staining in 5 dpf morphants (Piotrowski et al. 1996); hyoid (hy) is abnormal, ceratobranchials 1-3 (cb) are shortened and ceratobranchials 4-5 are missing (class III, 24%; class II morphants lack cb 3-5 and class I lack cb1/2-5; 63% and 13%, respectively, n=215). (E,F) prdm1 and aldh1a2 share expression domains in the branchial arch (ba) and pectoral fin bud (fb) primordia (Grandel et al., 2002). (F-I) Morphant embryos exhibit reduced aldh1a2 expression in branchial arch and pectoral fin primordia; and eyes (ey) and somites (sm). (J-M) Eye size and rho expression in photoreceptor cell layer (pl) (Vihtelic et al., 1999) is reduced in morphants; lens (le) and retina lamination (rt) appear normal, whereas rho expression is generally reduced and missing regionally (arrows). (N,O) Reduced number of green-sensitive Opsin-expressing cells in PCL of morphants, detected by a-grOpn antibody (Vihtelic et al., 1999); single focal level obtained by confocal microscopy. (P,Q) Strongly reduced number of Rhodopsin-expressing cells in PCL of morphants, detected by a-Rho antibody (Zpr3/Fret11, Vihtelic et al., 1999); images obtained by 3D reconstruction. Morphant eye dimensions are smaller. Cy3-conjugated secondary antibodies by Jackson ImmunoResearch were used. (R,S) Cloaca (cl) morphology is abnormal in morphants. Scale bar: 200 µm in A,C,I; 100 µm in G,J,K; 50 µm in O,U. EXPRESSION / LABELING:
|

Unillustrated author statements EXPRESSION / LABELING:
PHENOTYPE:
|