- Title
-
Saltatory control of isometric growth in the zebrafish caudal fin is disrupted in long fin and rapunzel mutants
- Authors
- Goldsmith, M.I., Fisher, S., Waterman, R., and Johnson, S.L.
- Source
- Full text @ Dev. Biol.
|
fa93e10 expression cycles during ontogenetic fin growth. (A) Whole-mount in situ hybridization illustrating fa93e10 expression in an 8-week-old zebrafish caudal fin. fa93e10 expression (purple staining) is clearly seen at the distal tip of every fin ray (highlighted in six fin rays with black arrows). (B) fa93e10 expression was assessed by whole-mount in situ hybridization in 8- to 35-week-old zebrafish caudal fins (n = 10–150 fins for each age group). (C) In 11 groups of fish from (B) (n = 200), aged 13 weeks (open squares), 16 weeks (solid squares), 24 weeks (solid circles), and 35 weeks (open circles), fa93e10 expression is plotted relative to body size. Each data point represents mean body size (mm) and percent of fins expressing the growth marker fa93e10 for a single group of fish (n = 14–24). |
|
fa93e10 expression delimits cycles of cell proliferation. (A) A diagrammatic representation of a longitudinal section through a zebrafish caudal fin. Two hemirays are seen enclosing the intraray fin mesenchyme. The mesenchymal compartment is surrounded by a basement membrane and an epithelium, fa93e10 is expressed in the basal layer of the epidermis, illustrated in dark blue. For the purposes of counting proliferating cells (see F), the intraray mesenchyme was divided into a distal portion (distal most 250 µm, equivalent to one segment length) and a proximal portion (everything proximal to the distal portion). (B–E) Brightfield and fluorescence microscopy of longitudinal sections through a fa93e10-positive (B, C) and a fa93e10-negative (D, E) fin ray. (B) Brightfield illumination demonstrates fa93e10 expression in the basal layer of the epithelium (black arrowheads). (C) Fluorescence illumination of the same section (B) demonstrates 6 BrdU-labeled cells in the distal intraray fin mesenchyme (white arrowheads). Six epithelial cells are also highlighted (white arrows). (D) A representative fa93e10-negative section. (E) Fluorescence illumination of the same section (D) illustrates 3 BrdU-labeled cells in the epithelium (white arrows) but none in the mesenchyme. (F) Fifty contiguous longitudinal sections were cut from 6-month-old fa93e10-positive (n = 4) and fa93e10-negative (n = 5) fins that had been in vivo labeled with BrdU. Following BrdU immunohistochemistry, labeled cells in the distal intraray mesenchyme were counted. Labeled cells in the proximal intraray mesenchyme and epithelium were excluded. Values represent the mean number of BrdU labeled cells per 50 sections ± SD. |
|
Independent mesenchymal and epithelial regulation of cell proliferation. Proliferating cells (green), identified by whole-mount BrdU immunohistochemistry, can be seen in both fa93e10-positive (A, B) (purple staining, highlighted by white arrows in A) and fa93e10-negative (C) fins. At higher magnification (B), BrdU-labeled cells in the distal intraray mesenchyme (white arrowheads) are easily identified as they lie in the same focal plane as the actinotrichia (black arrow). (D) Total BrdU-labeled cells in distal fin (mesenchymal and epithelial) were counted for fa93e10-positive (n = 7) and fa93e10-negative (n = 10) fins. (E) fa93e10-positive fins contained significantly more BrdU-labeled cells in the distal intraray mesenchyme than fa93e10-negative fins. (F) To estimate the number of proliferating epithelial cells for fa93e10-positive and fa93e10-negative fins, we subtracted the number of proliferating cells in the intraray mesenchyme (E) from the total number of proliferating cells (D). |
|
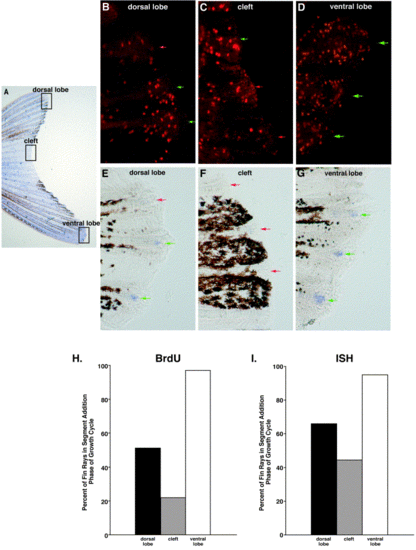
Asynchronous saltation in long fin. In separate experiments, interray growth synchrony in long fin was assessed by using either BrdU to label dividing cells or fa93e10 expression (ISH) to identify fin rays in the segment addition phase of the growth cycle. (A) A whole-mount caudal fin from a long fin heterozygote demonstrating asymmetric overgrowth. Black boxes highlight the three regions (dorsal lobe, cleft, ventral lobe) where growth was assessed. (B–G) Higher magnification views from the dorsal lobe (B, E), cleft (C, F), and ventral lobe (D, G) demonstrating BrdU-labeling (B–D) and fa93e10 expression (E–G). Three fin rays are shown in each photomicrograph. Green arrows identify fin rays in growth phase (>10 BrdU-labeled cells in the distal intraray mesenchyme or expressing the growth marker fa93e10). Red arrows identify fin rays in stasis (<10 BrdU-labeled cells in the distal intraray mesenchyme or not expressing the growth marker fa93e10). (H, I) Using BrdU-labeling (H, n = 33 fins/99 fin rays) or fa93e10 expression (I, n = 43 fins/129 fin rays), three fin rays from each of the dorsal lobe, cleft, and ventral lobe were scored as being either in growth phase or stasis. |
|
Synchronous overgrowth in rapunzel. (A) The rapunzel heterozygote has symmetrically fin overgrowth. (B) Fin length: body length ratio plotted against body length for rap (circles) and wild type (squares) clearly demonstrates allometric fin growth in rap in contrast to isometric growth seen in the wild type caudal fin. Lines represent approximate growth curves. (C) Fin overgrowth in rap is due to increased segment number (n = 4 fin rays for each of rap and wild type; P < 0.05). There is no significant difference in fin ray segment length between rap and wild type (n = 30 segments for each of rap and wild type; P > 0.05). Growth was assessed in 6-month-old rapunzel caudal fins via fa93e10 gene expression (D) and BrdU labeling (E). |
Reprinted from Developmental Biology, 259(2), Goldsmith, M.I., Fisher, S., Waterman, R., and Johnson, S.L., Saltatory control of isometric growth in the zebrafish caudal fin is disrupted in long fin and rapunzel mutants, 303-317, Copyright (2003) with permission from Elsevier. Full text @ Dev. Biol.


