
- Title
-
The identity and distribution of neural cells expressing the mesodermal determinant spadetail
- Authors
- Tamme, R., Wells, S., Conran, J.G., Lardelli, M.
- Source
- Full text @ BMC Dev. Biol.

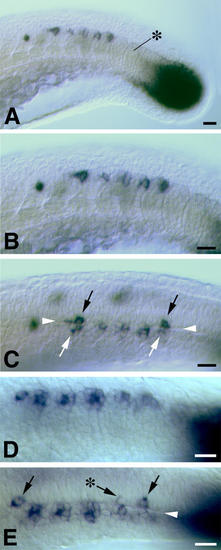
Whole mount in situ transcript hybridisation analysis of the expression of spt and other genes in the tail and trunk of zebrafish embryos at approximately 22 hpf. In all images, dorsal is up and rostral is to the left. An apparently irregular rostrocaudal distribution of spt-expressing cells is seen in the developing CNS rostral to the domain of expression in the presomitic mesoderm of the extending tail (A). Boxed areas in A indicate parts of the image magnified in B and C. Shortly after their birth, these cells extend a process rostrally (indicated by a black asterisk in B) into which spt transcript is transported. spt is expressed in newly formed somites in a restricted region, the "somitic trail" (bracketed in C), at the same dorsoventral level as spt-expressing cells in the developing CNS (black arrowheads in any panel). The spt-expressing cells in the developing CNS (red stain) co-express huC, a marker of neurons (blue stain in D). A probe that identifies cells transcribing val (blue stain) shows that the spt-expressing neurons (red stain) are not identical with these (E). Transcription of the isl-1 gene (see F) is seen dorsally in Rohon-Beard neurons (black arrows in any panel), and ventrally in motoneurons (white arrow). Intermediate between these two levels are DoLA neurons that also express isl-1 (black arrowhead). Double staining with isl-1 (blue) and spt (red) shows that these intermediate-level neurons express spt (G). Costaining of spt (red) with isl-2 (blue in H) and isl-3 (blue in I) shows that the DoLA neurons also apparently express these genes, although the onset of expression occurs more rostrally than for isl-1. Scale bars equal 100 μm in A, B, C and F and 20 μm in D, E, G, H, I. EXPRESSION / LABELING:
|

Close association of neurons expressing spt with the dorsal longitudinal fasciculus. Images shown are projections of serial 0.5 μm optical sections through a 22 hpf embryo stained to reveal spt transcripts (red) and acetylated tubulin (green) that marks axons. The cell shown lies in that part of the developing spinal cord midway along the yolk extension. Rostral is to the left in both images. A shows a lateral projection with dorsal to the top. B shows a dorsal projection with medial to the bottom and lateral to the top. The size bar in A indicates 10 μm. B has an identical rostrocaudal dimension but the mediolateral dimension is compressed. The size bar in B indicates 10 μm in the mediolateral dimension. EXPRESSION / LABELING:
|
The juxtaposition of spt expression in newly formed somites and the developing CNS at approximately 22 hpf. In all images dorsal is uppermost and rostral is to the left. A, B and C are views from one embryo. A and B show the appearance from a lateral view of the tail in the region of the "somitic trail" of spt expression. A black asterisk indicates the most recently formed somite. spt expression is concentrated to the dorsocaudal extremity of somites. In an optical (DIC) section through the same embryo viewed from a dorsolateral perspective (C), the basal lamina separating the developing CNS and the somitic mesoderm can be seen clearly (arrowheads). Cells expressing spt in the developing CNS (black arrows) are juxtaposed to somitic cells expressing spt (white arrows). The "somitic trail" region of a second embryo is shown in D (lateral view) and E (dorsolateral view). The black asterisk in E indicates a neural cell expressing a lower level of spt. Scale bars equal 20 μm. EXPRESSION / LABELING:
|
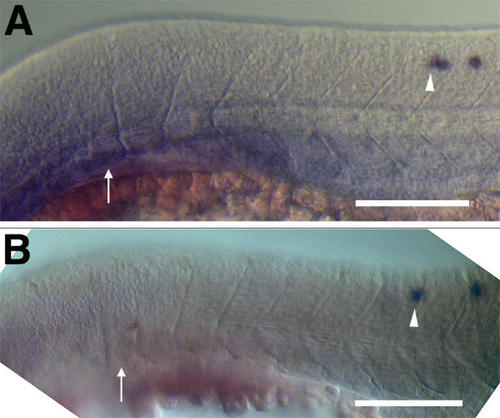
Lateral views of two embryos (A and B) at approximately 24 hpf stained to reveal spt transcription. Dorsal is up and rostral is to the left. DIC microscopy was used to reveal somite boundaries. Consequently, spt-expressing cells in the developing CNS are not seen clearly because they lie in a different focal plane. However, the most rostral cell in each embryo is indicated by a white arrrowhead. The most rostral visible discernible somite is indicated by a white arrow. In both cases there are 6 somites rostral to the most rostral spt-expressing neuron. Scale bars equal 100 μm. |
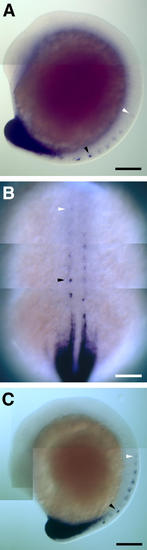
Early spt expression in the developing CNS and somites. A and C show lateral views of two embryos at 16 hpf. Rostral is up and dorsal is to the right. B shows a dorsal view of the embryo in A. Rostral is up. White arrowheads indicate the most rostral somitic domain of spt transcription visible. Black arrowheads indicate the most rostral neural cell expressing spt. For B, the light source was concentrated behind the yolk to give greater visibility of staining. All images are composites of smaller images. Scale bars equal 100 μm. EXPRESSION / LABELING:
|