
- Title
-
parachute/n-cadherin is required for morphogenesis and maintained integrity of the zebrafish neural tube
- Authors
- Lele, Z., Folchert, A., Concha, M., Rauch, G.-J., Geisler, R., Rosa, F., Wilson, S.W., Hammerschmidt, M., and Bally-Cuif, L.
- Source
- Full text @ Development
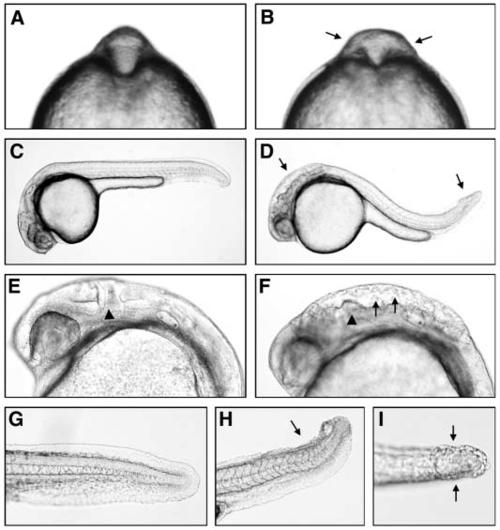
pac mutants exhibit abnormal brain and tail morphogenesis. (A,C,E,G) Wild-type siblings, (B,D,F,H,I) pacfr7 mutants. (A,B) Eight-somite stage, frontal view, arrows in B indicate broadened neural tube at midbrain-hindbrain level. (C-I) 24 hpf. (C,D) lateral overview; arrows in D indicate sites of phenotypic defects in the midbrain-hindbrain region and tip of tail. (E,F) Magnification of head region; arrowheads in E,F indicates the position of the midbrain-hindbrain boundary, arrows in F indicate loose cell aggregates in ventricle. (G-I) Magnification of tip of tail; lateral view (G,H) and dorsal view (I); arrows in H,I indicate region with split dorsal fin. PHENOTYPE:
|
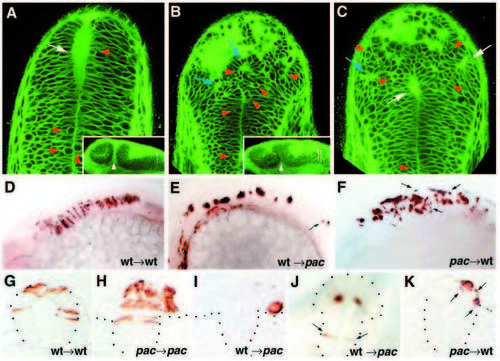
The pac mutation affects cell-cell adhesion in the midbrain-hindbrain region. (A-C) Bodipy ceramide staining; 24 hpf; confocal microscopic cross sections at hindbrain levels; (A) wild-type sibling, (B,C) pacfr7 mutant. Red arrowheads indicate rounded cells, blue arrows indicate ectopic rosette-like structures in dorsal regions of the pac mutant, and white arrows indicate ventricle lumen of the neural tube and ectopic lumina in dorsal rosette-like structures in pac. Insets in A,B show longitudinal sections through the mid- and hindbrain. The midbrainhindbrain boundary (mhb) is indicated by white arrowheads and levels at which the crosssections are taken are indicated by white arrows. Note the less pronounced mhb in pac mutant (B). (D-K) Chimeric embryos after transplantation of wild-type or pac mutant cells into wildtype or pac mutant hosts, as indicated: 24 hpf; lateral view of the mid- and hindbrain (D-F) and transverse sections at midbrain-hindbrain level (G-K). Note the tighter organization of the aggregate in I compared with K. Arrows in E,F,J,K indicate isolated cells. Note that in K, isolated pac mutant cells have a rounded shape, in contrast to their elongated wild-type neighbors (compare with alar wild-type cells in G). PHENOTYPE:
|
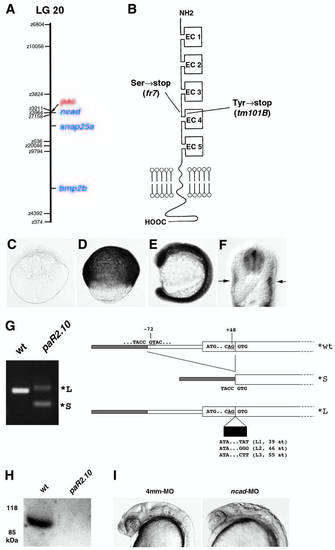
pac encodes N-cadherin. Map positions of the pactm101B mutation and the ncad gene on linkage group 20. Cartoon of the structure of Ncad protein. As indicated, Ncad encoded by pacm101B and pacfr7 displays premature terminations in the extracellular region, shortly after the EC3 domain. (C-F) Expression pattern of ncad. (C) Eight-cell stage, lateral view. (D) 80% epiboly stage, lateral view. (E) Fifteen-somite stage, lateral view. (F) 24 hpf, cross-section at trunk level. ncad expression is restricted to neural tube and slow muscle fibers. (G) RT-PCR analysis of ncad transcripts from pacpaR2.10 mutants, and structure of their 5′ regions. From pacpaR2.10 RNA, no wildtype, but only a predominant smaller transcript (*S) and different larger ncad transcripts (*L) were amplified. (H) Western blot analysis of protein extracts from a pacpaR2.10 and a wild-type sibling embryo with a polyclonal antibody against EC domains 4,5 of zebrafish Ncad (Bitzur et al., 1994). The wild-type extract gives an Ncad-positive band of the expected size, whereas no such band is seen in extracts from the pacpaR2.10 mutant. Before antibody incubation, the blot had been stained with Ponceau Red, showing that equal amounts of proteins were loaded in both lanes. Similar analyses failed to detect Ncad protein from pacfr7 mutants, as expected, because, according to the cDNA sequence, pacfr7 mutant protein terminates after the third EC domain. (I) Phenocopy of the pac mutant phenotype with anti-ncad morpholino ncad-MO1 (right, compare with Fig. 1F) and with the four-mismatch control MO (left) (see Materials and Methods). Embryos at 24 hpf, lateral view of head region. PHENOTYPE:
|
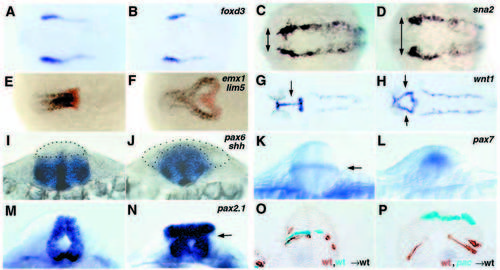
Lack of Ncad causes neurulation defects. (A-N) Whole-mount in situ hybridization for the markers indicated in the top right-hand corner. Dorsal views with anterior towards the left in A-H; optical cross sections dorsal upwards in I-N; all paired panels compare a pac mutant (right) with a wild-type sibling (left). (O,P) Mid-hindbrain cross-sections of wild-type embryos co-transplanted with cells from two different donors, as indicated in the bottom right-hand corner; donor cells are stained in cyan or brown. (A,B) foxd3, three-somite stage; note the identical mediolateral extent of the neural plate in wild-type and pac. (C,D) sna2, five-somite stage; arrows indicate the width of neural plate delineated by sna2 stripes, larger in pac. (E,F) emx1 (blue; marking telencephalon) + lim5 (red; marking posterior diencephalon) (Toyama et al., 1995a), 10- somite stage. In F, cells in the fused part of the lim5 expression domain are located ventrally, cells in the bilateral parts dorsally. (G,H) wnt1, 26 hpf; arrows indicate fused (G) and bilateral (H) expression domains in the midbrain. (I,J) pax6 + shh; 12-somite stage; section at hindbrain level. The alar plate devoid of pax6 staining is outlined by dots. (K,L) pax7, 16-somite stage; optical section at hindbrain level. Arrow in K indicates a pax7 stripe in the interface of basal and alar plate. (M,N) pax2.1, 24 hpf; optical cross-section through midbrain-hindbrain boundary region; arrow indicates the region where basal and alar plate have morphologically separated. (O,P) Chimeric embryos, 24 hpf, cross-section at midbrain (P) and hindbrain (O) levels. Note that in P, wild-type cells (in brown) populate the basal plate, while pacpaR2.10 mutant cells (in cyan) remain alar, although both cell types had initially been transplanted to the same presumptive basal region of the host embryo. EXPRESSION / LABELING:
PHENOTYPE:
|
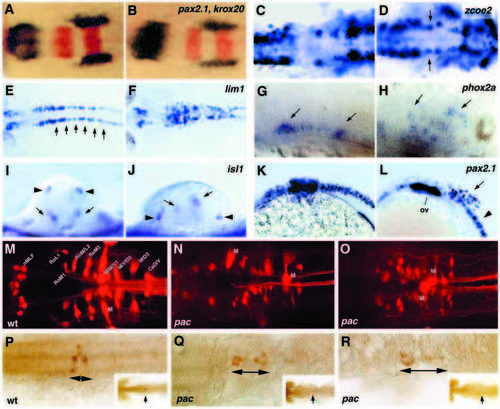
Lack of Ncad causes neuronal positioning defects. In situ hybridization (A-L), retrograde labeling of reticulospinal neurons (M-O) and tracing of cellular clones after labeling single neuroectodermal cells at the gastrula stage (P-R). All paired panels in A-L compare a pac mutant (right) with a wild-type sibling (left). (A-F) Dorsal views of the mid- and hindbrain, anterior towards the left; (G,H,K,L) sagittal views of the mid- and hindbrain, anterior towards the left; (I,J) optical cross-sections at hindbrain level, dorsal upwards. (A,B) pax2.1 (blue) and krox20 (red), 18-somite stage. (C,D) zcoe2, 18-somite stage, arrows in D indicate misplaced motoneurons in the midbrain-hindbrain boundary region. (E,F) lim1; 26 hpf; arrows in E indicate the rhombomeric pattern, altered in pac (F). In addition, note that the number of lim1-positive cells in the mutant is strongly increased. (G,H) phox2a, 36 hpf; arrows indicate ventral and dorsally misplaced motoneurons. (I,J) isl1, 24 hpf; arrows indicate motoneurons, arrowheads indicate Rohon-Beard sensory neurons. (K,L) pax2.1, 26 hpf; arrow in L indicates scattered interneurons in hindbrain area. ov, otic vesicle. (M-N) Pattern of reticulospinal neurons (specified in M) in wild-type (M) and two different pacpaR2.10 mutant embryos (N,O; Mauthner neurons are indicated by ‘M’); dorsal view on midbrain-hindbrain region at 120 hpf. Patterns in mutants appear randomized, and differ from individual to individual. Although each labeling is unlikely to label all reticulospinal neurons, the patterns observed clearly lack bilateral symmetry at least for the Mauthner neuron (identified by its characteristic elongated shape and large diameter axon, out of focus on O). (P-R) Representative clones (brown) deriving from labeled single cell of the hindbrain region of a wild-type (P) and two pacpaR2.10 mutant gastrulae (Q,R). Dorsal view of the hindbrain at 24 hpf. Arrows indicate the length of the clones along AP axis. Insets show overviews of the activated embryos, indicating the position of the clones in each embryo (arrows). EXPRESSION / LABELING:
PHENOTYPE:
|
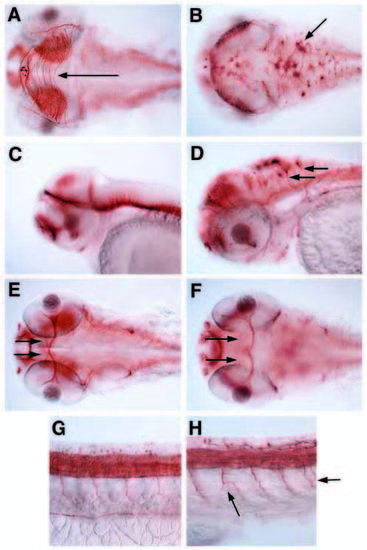
Lack of Ncad leads to ectopic neurons in dorsal regions of mid-hindbrain and axonal projection defects. Anti-acetylated tubulin immunostaining in (A,C,E,G) wild type and (B,D,F,H) pac fr7 mutant; 60 hpf; dorsal/ventral views (A,B,E,F) and lateral view (C,D) of the head, and lateral view of the trunk anterior of the anus (G,H). (A-D) Arrow in A indicates tectal commissures missing in B. Arrows in B,D indicate large dorsal neurons projecting axons to each other (B) and ventrally (D). (E,F) Arrows indicate optic nerves crossing the midline in optic chiasma in E, but not in F. (G,H) Left arrow in H indicates branching intersomitic axon, right arrow indicates two converging axons from different motoneurons. |
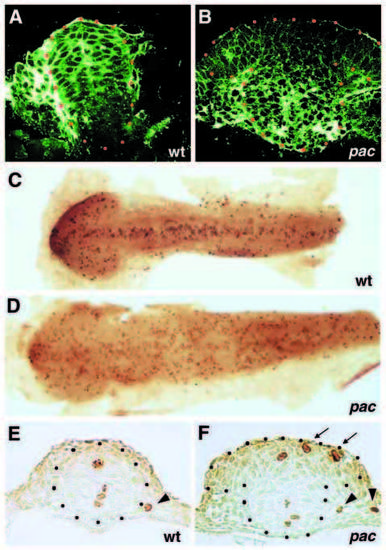
pac mutants display loss of membrane-associated β-catenin and enhanced cell proliferation in dorsal regions of midbrain and hindbrain. (A,B) Anti-b catenin immunostaining on 2 mm confocal cross-sections through the hindbrain of wild-type (A) and pac paR2.10 mutant sibling (B); 12-somite stage. (C-F) Anti-phospH3 immunostaining of wild-type sibling (C,E) and pacfr7 mutant (D,F) embryos of the 12-somite stage; flat mounts of whole embryos (C,D), and representative cross-sections at the hindbrain level (E,F). Mitotic cells in the lateralmost position (indicated by arrowheads) are not part of the neural tube and are probably migrating neural crest cells. In A,B,E,F, the neural tube is outlined by dots. Arrows in F point to ectopic phospH3-positive cells in alar region of mutant. PHENOTYPE:
|