
- Title
-
Expression of the zebrafish genome during embryogenesis (NIH R01 RR15402)
- Authors
- Thisse, B., Pflumio, S., Fürthauer, M., Loppin, B., Heyer, V., Degrave, A., Woehl, R., Lux, A., Steffan, T., Charbonnier, X.Q. and Thisse, C.
- Source
- Submitted By
- Thisse, Bernard, Thisse, Christine (Citing this work)
- Protocol
- Thisse in situ hybridization protocol
- Probe
- cb744 Quality:
- Supplier
-
Supplier: Zebrafish International Resource Center (ZIRC) (order this)
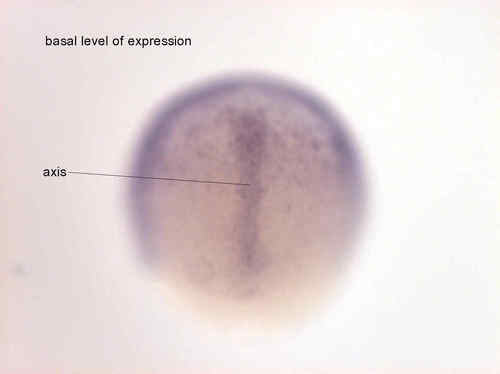
basal level of expression EXPRESSION / LABELING:
|


Fig. 2 expression in polster and in notochord (in this tissue RNA accumulate in perinuclear location) EXPRESSION / LABELING:
|


Fig. 3 expression in notochord (in perinuclear location) and in chordo neural hinge EXPRESSION / LABELING:
|

Expression in lens and in brain ventricular zone EXPRESSION / LABELING:
|

Basal level of expression in the brain |

Basal level of expression in the brain. More staining in retina |