
- Title
-
Expression of the zebrafish genome during embryogenesis (NIH R01 RR15402)
- Authors
- Thisse, B., Pflumio, S., Fürthauer, M., Loppin, B., Heyer, V., Degrave, A., Woehl, R., Lux, A., Steffan, T., Charbonnier, X.Q. and Thisse, C.
- Source
- Submitted By
- Thisse, Bernard, Thisse, Christine (Citing this work)
- Protocol
- Thisse in situ hybridization protocol
- Probe
- cb740 Quality:
- Supplier
-
Supplier: Zebrafish International Resource Center (ZIRC) (order this)
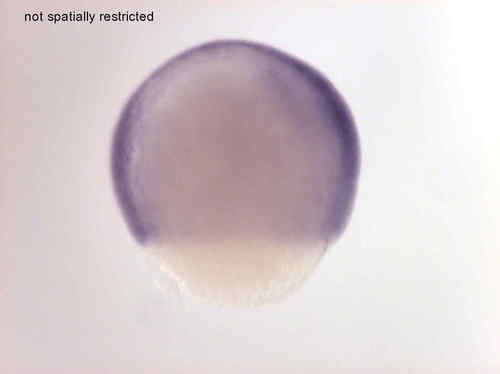
Basal level of expression. Not spatially restricted. EXPRESSION / LABELING:
|

basal level of expression, more staining in segmental plate and adaxial cells EXPRESSION / LABELING:
|


Fig. 3 basal level of expression, more in eye, midbrain, somites EXPRESSION / LABELING:
|

basal level of expression, more in eye, tectum, myotomes, ventral hematopoietic mesoderm; branchial arches EXPRESSION / LABELING:
|


Fig. 5 basal level of expression, more in retina, tectum, myotomes, branchial arches |


Fig. 6 basal level of expression, more in retina, tectum, myotomes, liver, branchial arches |