
- Title
-
Mutational analysis of endothelin receptor b1 (rose) during neural crest and pigment pattern development in the zebrafish Danio rerio
- Authors
- Parichy, D.M., Mellgren, E.M., Rawls, J.F., Lopes, S.S., Kelsh, R.N., and Johnson, S.L.
- Source
- Full text @ Dev. Biol.

Wild-type and rose mutant adult D. rerio. (A) Wild-type adults exhibit several dark stripes comprising melanocytes and iridophores, with intervening light stripes comprising xanthophores and iridophores. (B–D) rose mutant adults have fewer melanocytes than wild-type, and these cells form stripes dorsally but spots ventrally. rose mutants also exhibit an iridophore defect, which is especially noticeable lateral to the gills (arrow) and over the abdomen. (B) roseb140 adults exhibit a pigment pattern defect but are both viable and fertile as homozygotes. (C) rosej3e1 adults exhibit a similar pigment pattern defect to roseb140, but are severely runted. Shown is an individual comparable in age to that shown in (B). rosej3e1 adults that attain larger sizes exhibit only a single dorsal melanocyte stripe and a fragmented ventral melanocyte stripe, as in roseb140. (D) rosej3e3 mutant adults have a marginally less severe melanocyte defect, typically having one additional melanocyte stripe compared to roseb140 and rosej3e1. Scale bar: 1 cm. |

ednrb1 is expressed by cells of the neural crest–melanocyte lineage and is temporally and spatially correlated with endothelin-1 expression in the neural tube. (A) ednrb1+ (blue) cells are abundant over the anterior head, at the midbrain–hindbrain boundary (arrow), within the trunk premigratory neural crest (arrowhead), and in trunk neural crest migratory pathways at 22 h. (B) ednrb1+ cells are more widely scattered over the anterior trunk (arrow) but are still present in the premigratory neural crest in the posterior trunk (arrowhead) at 27 h. (C–E) Two-color in situ hybridization reveals ednrb1 expression by melanocytes and their precursors. (C,C′) Corresponding brightfield and epifluorescence views revealing ednrb1+ cells (blue, C) adjacent to the neural tube (nt) at the entrance to dorsolateral (arrow head) and ventrolateral neural crest migratory pathways. Both cells coexpress the melanocyte lineage marker, kit (red, C′). Shown is a 12-μm cryosection through the posterior trunk of a wild-type embryo. (D,D′) Corresponding images of a whole mount 24-h embyro showing cells coexpressing ednrb1+ (blue, D) and dct (red, D′; arrowheads) near the midbrain–hindbrain boundary. Adjacent cells express only ednrb1 (e.g., arrow). (E,E′) During later development (here, 28 h), ednrb1 continues to be expressed (blue, E) by lightly melanized melanocytes (arrowhead) that coexpress dct (red, E′). (F–H) endothelin-1 is expressed in the posterior trunk and tail developing neural tube. (F) endothelin-1 (edn1) expression is evident in the neural keel posteriorly (arrowhead) as well as in lateral mesoderm and in the vicinity of branchial arches anteriorly, at 20 h. (G) endothelin-1 continues to be expressed in the neural keel of the developing post-anal tail (arrowhead), here shown at 24 h. (H) A longitudinal optical section through the midline posterior trunk of a whole mount 22-h embryo reveals endothelin-1 expression within the middle of the neural keel (nk), although not in the floorplate (f) or dorsal-most layer of neural keel cells (presumptive neural crest, nc). e, epidermis; nch, notochord. Scale bars: (A,B) 400 μm; (C,C′) 10 μm; (D,D′) 10 μm; (E,E′) 10 μm; (F,G) 70 mm; (H) 20 μm. |

ednrb1 is expressed by nonmelanocytic neural crest-derived pigment cell lineages during embryonic pigment pattern development. (A–D) Molecular marker and mutant analyses reveal ednrb1 expression by xanthophore precursors. (A,A′) Corresponding brightfield and epifluorescence views revealing ednrb1+ cells (blue, A) that coexpress fms (red, A7prime;; e.g., arrowhead). Shown is a 12-μm cryosection through the anterior trunk of a 24-h embryo. (B,B′) ednrb1+ cells (blue, B) also coexpress the xanthophore marker xdh (red, B′; e.g., arrowhead). Shown are cells in the dorsolateral neural crest migratory pathway in the middle trunk region of a 24-h embryo. (C,C′) Comparison of ednrb1 expression in wild-type (C) and fms mutant (C′) embryos reveals an abnormal accumulation of ednrb1+ cells at the midbrain–hindbrain junction (arrowhead). Shown are the heads of 26-h embryos. e, eye. (D,D′) In the midtrunk at 32 h, unmelanized ednrb1+ cells are present over the flank, between developing melanocyte stripes in wild-type embryos (D; e.g., arrowhead), but unmelanized cells are not present in this region in fms mutants. In contrast, ednrb1+ melanocytes are present in both wild-type and fms mutants (arrows). (E, F) ednrb1 is expressed by differentiated iridophores. (E) Individual iridophores (arrowheads) can be observed along the dorsal myotomes as highly reflective cells under oblique illumination in the posterior trunk of a living 72-h larva that has been treated with phenylthiourea to inhibit melanin synthesis. Yellow coloration in the dorsal trunk is due to xanthophore pigmentation. (E′) In the same individual processed for in situ hybridization, ednrb1+ cells (arrowheads) are present along the dorsal myotome in a pattern coincident with iridophores observed prior to histological preparation. Additional iridophores in ventral regions of the larva stain as well, but are out of the focal plane in (E′). In comparison with ednrb1 expression by iridophores, ednrb1 expression by xanthophore and melanocyte lineages is dramatically reduced at these stages and cannot be seen here. (F,F′) Comparison of ednrb1 expression between wild-type (F) and shady mutant (F′) embryos also supports the inference that ednrb1 is expressed by iridophores. (F) At 72 h in wild-type, unmelanized cells along the dorsal myotomes exhibit robust ednrb1 expression (arrowheads). (F′) In shady mutants, which lack iridophores, ednrb1 expression by unmelanized cells in the corresponding region is not observed. Scale bars: (A,A′) 60 μm; (B,B′) 40 μm; (C,C′) 40 μm; (D,D′) 100 μm; (E,E′) 60 μm; (F,F′) 50 μm. |
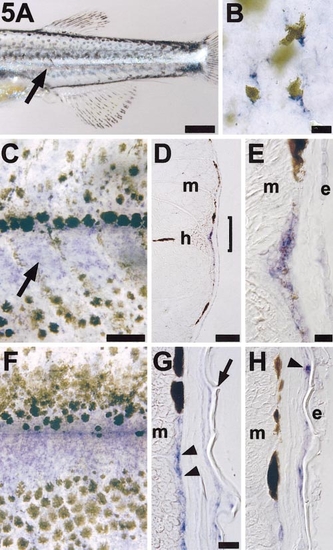
ednrb1 is reexpressed during pigment pattern metamorphosis. (A) A wild-type metamorphosing larva exhibits a bright stripe of iridophores (arrow) immediately ventral to the horizontal myoseptum and between the first developing dorsal and ventral melanocyte stripes. Shown is the posterior trunk of an 18-day larva. (B) Lightly melanized melanocytes express ednrb1 during pigment pattern metamorphosis. Shown are ednrb1+ (blue) melanocytes in flat-mounted skin from a 20 day larva. An additional dark melanocyte can be seen deeper within the larva and out of the plane of focus. (C) ednrb1 is strongly expressed by cells coincident with the developing first iridophore stripe (arrow) immediately ventral to the horizontal myoseptum. Shown is a 21-day larva. (D) A 12-μm cryosection through the trunk of a larva at the stage in (A). Blue ednrb1+ cells can be seen superficial to the myotome (m) and beneath the epidermis near the horizontal myoseptum (h). (E) Higher magnification view of the bracketed region in (D), showing ednrb1+ cells between the myotome (m) and epidermis (e). Spatial resolution among these cells does not allow distinguishing whether faint melanin deposition is associated with ednrb1+ cells or intermingled cells that may not express ednrb1. (F) During later stages of pigment pattern metamorphosis (here, 28 days), ednrb1 expression is maintained between melanocyte stripes and also is evident at lower levels within melanocyte stripes. (G) Cryosection of a similarly staged larva reveals ednrb1+ cells (arrowheads) in the same plane as melanocytes that contribute to dark horizontal stripes. Arrow, dermal scale. (H) Unmelanized ednrb1+ cells (arrowhead) also are evident superficial to stripe melanocytes, associated with the inner surface of scales. Scale bars: (A) 400 μm; (B) 10 μm; (C,F) 100 μm; (D) 100 μm; (E) 10 μm; (G,H) 20 μm. |
Reprinted from Developmental Biology, 227(2), Parichy, D.M., Mellgren, E.M., Rawls, J.F., Lopes, S.S., Kelsh, R.N., and Johnson, S.L., Mutational analysis of endothelin receptor b1 (rose) during neural crest and pigment pattern development in the zebrafish Danio rerio, 294-306, Copyright (2000) with permission from Elsevier. Full text @ Dev. Biol.