
- Title
-
Programmed cell death in zebrafish Rohon Beard neurons is influenced by TrkC1/NT-3 signaling
- Authors
- Williams, J.A., Barrios, A., Gatchalian, C., Rubin, L., Wilson, S.W., and Holder, N.
- Source
- Full text @ Dev. Biol.
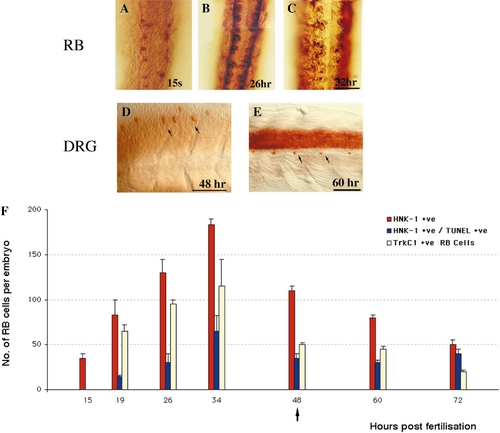
Rohon Beard cell generation and loss during early development. (A–C) HNK-1-labeled RB cells in spinal cords of zebrafish embryos at 15 s (A), 26 hpf (B), and 32 hpf (C). Dorsal views with anterior up. Scale bar, 50 μm. (D and E) Anti-Hu-labeled DRG at 48 (D) and at 60 hpf (E). At 48 hpf, only a small number of neurons (arrows) are labeled in the most anterior DRG, whereas by 60 hpf, one or two neurons are labeled in each of the DRG segmentally positioned along the trunk (arrows). Lateral views with anterior to the left. (F) Graph showing the total number of HNK-1+ differentiated RB cells (red), the number of apoptotic (TUNEL-labeled) RB cells (blue), and the number of trkC1-positive RB cells (yellow) per embryo over time. Values represent means ± SEM. Arrow indicates the stage at which DRG neurons start to differentiate. |

Rohon Beard neurons die by caspase-dependent programmed cell death. (A–D) Dorsal views of spinal cords at 26 hpf (B–D) or a lateral view of a whole embryo at 28 hpf (A). (A) TUNEL labeling reveals a row of large apoptotic cells (arrow) within the dorsal spinal cord. (B) Double labeling with HNK-1 antibody (brown) and TUNEL (black) shows that a subpopulation of RB cells is dying. Two double-labeled cells are indicated with arrows. (C) zFAfmk (a control peptide)-treated embryo double labeled with HNK-1 (brown) and TUNEL (black). Double-labeled cells (arrows) are found in a frequency similar to that of wild-type embryos. (D) Caspase inhibitor zVADfmk-treated embryo double labeled with HNK-1 (brown) and TUNEL (black). There are no dying cells in this example. Scale bar, 25 μm. (E) Graph showing that the caspase inhibitor zVADfmk significantly reduces programmed cell death of RB cells in 26-hpf but not 48-hpf embryos compared to untreated and zFAfmk-treated controls. Values represent means ± SEM of five separate determinations. **P < 0.02, according to the Student t test. |
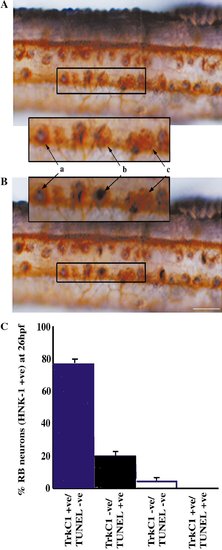
trkC1 expression is restricted to Rohon Beard cells not undergoing apoptosis. (A and B) Equivalent dorsal views of spinal cords of the same 26-hpf embryo initially labeled with HNK-1 (brown) and a probe for trkC1 (blue) and shown in (A). The embryo was then labeled by TUNEL to reveal dying cells (dark brown) and is shown again in (B). (A) trkC1 is expressed in a subpopulation of RB cells. The inset indicates one trkC1-expressing HNK-1+ neuron (a) and two HNK-1+ neurons that do not express trkC1 (b and c). (B) TUNEL labeling reveals that the trkC1-expressing RB cell (a) is not apoptotic. One of the HNK-1+/TrkC1- cells (b) is apoptotic and one is not (c). None of the trkC1+ neurons were double labeled by TUNEL. Scale bar, 25μm. (C) Graph showing the different percentages of TrkC1+/TUNEL-, TrkC1-/TUNEL+, TrkC1/TUNEL-, and TrkC1+/TUNEL+ RB cells in 26-hpf embryos (n = 5). |
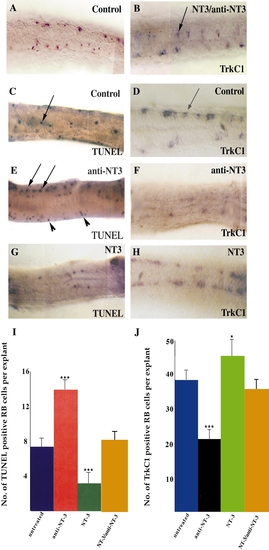
Anti-NT-3 induces Rohon Beard cell death, whereas NT-3 reduces death and leads to an increase in trkC1-expressing neurons. (A–G) Dorsal views of 22-hpf (A, C, E, G) and 20-hpf (B, D, F, H) explant cultured spinal cords with anterior to the left. (A–D) Control preparations showing explants labeled to reveal HNK-1-expressing RB neurons (A), trkC1-expressing RB cells in an explant treated with anti-NT-3 (20 ng/ml) and NT-3 (2 ng/ml) (B, arrow indicates trkC1+ cell), TUNEL-labeled apoptotic cells (C, arrow indicates large RB cell undergoing cell death), and trkC1-expressing RB cells in a control explant (D, arrow indicates trkC1+ RB cell). (E) Explant treated with anti-NT-3 (20 ng/ml) for 6 h exhibiting an increased number of dying RB cells (arrows) compared to C, as determined with TUNEL. Some other cells in the skin and spinal cord are also dying (arrowheads). (F) Explant treated with anti-NT-3 (20 ng/ml) for 4 h exhibiting a decreased number of trkC1-expressing RB cells compared to D. (G) Explant treated with NT-3 (2 ng/ml) for 6 h exhibiting a decreased number of dying cells as determined by TUNEL compared to C. (H) Explant treated with NT-3 (2 ng/ml) for 4 h exhibiting an increased number of RB cells expressing trkC1 compared to D. (I) Graph showing the number of TUNEL-positive RB cells per 26-somite stage (22 hpf) zebrafish explant in untreated, anti-NT-3-treated (20 ng/ml), NT-3-treated (2 ng/ml), and both anti-NT-3 (20 ng/ml) and NT-3 (2 ng/ml)-treated conditions. (J) Graph showing the number of trkC1-positive RB cells per 22-somite stage (20 hpf) zebrafish explant in untreated, anti-NT-3-treated (20 ng/ml), NT-3-treated (2 ng/ml), and both anti NT-3 (20 ng/ml) and NT-3 (2 ng/ml)-treated conditions. Values represent means ± SEM of five separate determinations ***P < 0.01, *P < 0.05 according to the Student t test. |
Reprinted from Developmental Biology, 226(2), Williams, J.A., Barrios, A., Gatchalian, C., Rubin, L., Wilson, S.W., and Holder, N., Programmed cell death in zebrafish Rohon Beard neurons is influenced by TrkC1/NT-3 signaling, 220-230, Copyright (2000) with permission from Elsevier. Full text @ Dev. Biol.