
- Title
-
Genetic analysis of melanophore development in zebrafish embryos
- Authors
- Kelsh, R.N., Schmid, B., and Eisen, J.S.
- Source
- Full text @ Dev. Biol.

dct is a marker for melanoblasts both during and after migration. (A) Lateral view of 25-hpf wild-type embryo shows no melanin in the posterior trunk. (B) In contrast, dct in situ RNA hybridisation at the same stage reveals many strongly labelled cells (purple). (C and D) Transverse sections through trunk of labelled embryos reveals that these cells are found on both the medial (arrows) and the lateral (arrowhead) neural crest migration pathways. (E) Lateral view of dorsal head of 48-hpf wild-type embryo labelled with dct shows purple in situ hybridisation product in all melanophores (brown colour is melanin). (F) Dorsolateral view of posterior head at 24 hpf to show melanoblasts (arrow) migrating on dorsal yolk sac (y). A cluster of dct-positive melanoblasts sits posterior to the otic vesicle (o). (G–J) Time course of dct expression pattern revealed by in situ RNA hybridisation; lateral views of trunk and tail. (G) 21, (H) 24, (I) 27, and (J) 30 hpf. Embryos are actively elongating at these stages, as seen here in the tail; all embryos are aligned by position of anus (distal end of yolk sac extension; arrow). Posterior shift in posteriormost boundary of dct-expressing cells is indicated by arrowheads. Note how posteriormost dct expression is always in cells located dorsal or dorsolateral to the spinal cord, but that more anterior cells are found more ventrally, including many in or near the ventral stripe located above the yolk sac (I, J). Many cells show an elongated, migratory morphology. In contrast, postmigratory cells show a flattened, more symmetrical morphology, e.g., dorsal stripe melanoblasts are seen as flattened cells (asterisks) on the dorsal aspect of the spinal cord (sc). Their number increases with age, from zero at 21 hpf (A) to many at 30 hpf (D). Subsequently, the number increases further. Dorsal uppermost, anterior to left in this and other figures unless stated otherwise. C and D are transverse sections, dorsal uppermost. m, muscle; no, notochord; pre, PRE; sc, spinal cord. Scale bar: 25 μm (A, B), 20 μm (C, D, F), 50 μm (E, G–J). EXPRESSION / LABELING:
|
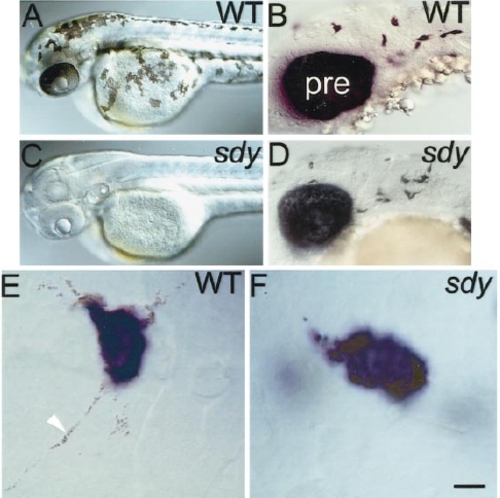
sdy- embryos lack melanin but have the wild-type number of melanoblasts. Dorsolateral views of head and anterior trunk in 2-dpf wild-type (A) and sdy- (C) embryos to show lack of melanin. In contrast, dct in situ hybridisation reveals a normal number and distribution of melanoblasts at 27 hpf (D, compare to wild type in B). Note also the normal levels of dct expression in the PRE. (E and F) High-magnification view of labelled melanophores in hybridised 27-hpf embryos reveals dct-positive melanoblasts in sdy- embryos (F), which lack the melanin so prominent in wild-type melanophores (arrowhead, E). alb- embryos show same phenotype (data not shown). pre, PRE. Scale bar: 200 μm (A, C), 50 μm (B, D), 10 μm (E, F). |

tdo mutants have disrupted melanophore differentiation, but have the wild-type number of melanoblasts. Lateral views of 2-dpf wild-type (A) and tdo- (C) embryos show highly reduced melanin in latter. In contrast, dct in situ hybridisation reveals a normal number and distribution of melanoblasts at 27 hpf (D, compare to wild-type in B). Note also the normal levels of dct expression in the PRE. (E and F) High-magnification view of labelled melanophores in hybridised 27-hpf embryos reveals dct-positive melanoblasts in tdo- (F). In wild-type melanophores melanin granules are dispersed in cell extensions (arrowhead, E), whilst tdo- melanophores show melanin clustered in the centre of the cell body (arrowhead, F). Thus, in wild types, melanin is more widely dispersed in the cell than dct transcripts (E), whilst in tdo- embryos it is less widely dispersed (F). Scale bar: 210 μm (A, C), 50 μm (B, D), 20 μm (E, F). |
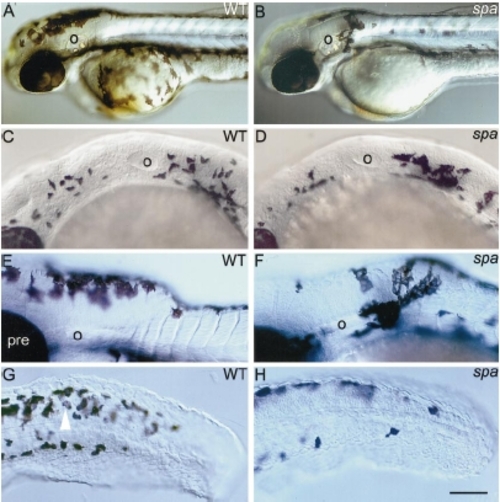
spa- embryos show reduced numbers and migration of melanoblasts. Lateral views of 2-dpf wild-type (A) and spa- (B) embryos to show reduced numbers of ventral melanophores and an ectopic cluster behind otic vesicle (o). Wild types (C, E) and spa- siblings (D, F) show large numbers of dct-positive cells in the posterior head at 25 hpf (C, D), but reduced numbers in spa- embryos at 36 hpf (F; compare E). These melanoblasts remain more densely clustered, particularly just posterior to the otic vesicle (E, F). (G, H) Melanin and dct mark melanophores, whilst dct alone marks melanoblasts (white arrowhead) in the tail of wild types (G) and spa- siblings (H) at 36 hpf. Note the paucity of ventral melanophores in mutant embryos. Scale bar: 200 μm (A, B), 75 μm (C, D), 100 μm (E, F), 75 μm (G, H). |
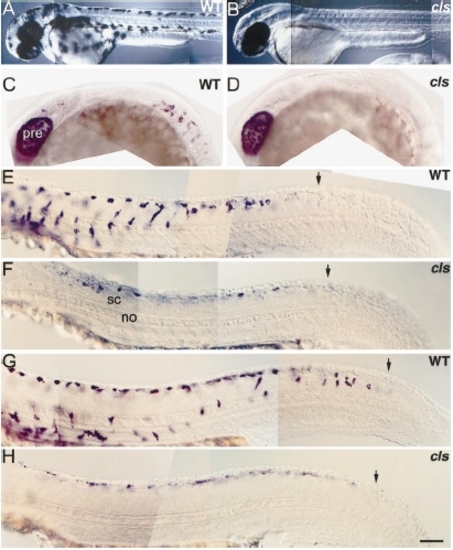
cls- embryos have very reduced melanoblast numbers. Lateral views of 2-dpf wild-type (A) and cls- (B) larvae to show severe melanophore defect. (C–H) Wild-type and cls- embryos processed for dct in situ hybridisation. (C, D) Lateral views of head and trunk at 21 hpf reveal earliest detected cls- phenotype; melanoblasts are absent from mutants at this stage. Note that the PRE expresses dct at the normal high levels. Lateral views of trunk and tail at 24 (E, F) and 30 hpf (G, H) show reduced melanoblast number in mutants. These cells are expressing dct at lower levels (all embryos were processed simultaneously and the staining reactions developed for the same amount of time) and none of them have migrated away from the neural tube. Note, however, that the timing of dct expression is normal: the posterior boundary of dct-positive cells is similar in wild types and mutants (arrows). Abbreviations as Fig. 2. Scale bar: 200 μm (A, B), 100 μm (C, D), 50 μm (E–H). PHENOTYPE:
|

dct-positive melanoblast numbers in tail of cls- embryos. Total numbers of labelled cells in postanal region of embryos analysed for dct expression are presented. Sample size (n) given at top of column. |

Unillustrated author statements EXPRESSION / LABELING:
|
Reprinted from Developmental Biology, 225(2), Kelsh, R.N., Schmid, B., and Eisen, J.S., Genetic analysis of melanophore development in zebrafish embryos, 277-293, Copyright (2000) with permission from Elsevier. Full text @ Dev. Biol.