
- Title
-
Mesendoderm and left-right brain, heart and gut development are differentially regulated by pitx2 isoforms
- Authors
- Essner, J.J., Branford, W.W., Zhang, J., and Yost, H.J.
- Source
- Full text @ Development
|
(A) pitx2c is expressed in the early mesendoderm and prechordal plate, and pitx2a is expressed late in the anterior prechordal plate (polster). Expression was detected by in situ hybridization. (a,b,e,f,i,j,m,n) A full-length pitx2 probe was used to detect all pitx2 transcripts. (c,g,k,o) An isoform specific 5′-UTR probe from pitx2a. (d,h,l,p) An isoform specific 5′-UTR probe from pitx2c. (a-d) 40-50% epiboly: (a,b) pitx2 expression was observed in marginal blastomeres (arrowheads) with increased levels on the dorsal side. (c) No expression of pitx2a was detected. (d) Expression of pitx2c in marginal blastomeres (arrowhead). (e-h) 90% epiboly: (e,f) pitx2 expression in the prechordal plate. (g) No expression of pitx2a was detected. (h) pitx2c expression in the prechordal plate. (i-l) bud stage: (i,j) pitx2 expression in the polster and posterior prechordal plate. (k) pitx2a expression in the polster. (l) pitx2c expression in the polster and posterior prechordal plate. (m-p) 4-6 somites: (m,n) pitx2 expression was observed in both the polster and posterior prechordal plate. (o) pitx2a expression in the polster. (p) pitx2c expression in the polster and the posterior prechordal plate. In a,c,d,e,i,m, embryo views are lateral with dorsal to the right. In b, animal pole view is shown with dorsal to the right. In f-h, j-l and n-p, dorsoanterior views are shown with anterior at the top. Bars indicate the extent of expression in the prechordal plate along the anteroposterior axis. (B) Northern blot hybridizations using isoform-specific 5′-UTR probes on RNA isolated from staged embryos. The same blot was used in all panels. Ethidium bromide staining of 18S ribosomal RNA is shown at the bottom as a loading control. 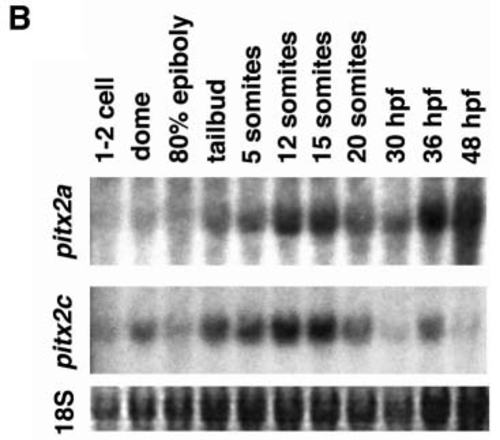

EXPRESSION / LABELING:
|

Mesendoderm expression of pitx2c is dependent on spt, oep, sur and cyc. In situ hybridizations using a full-length pitx2 probe are shown. (A-C) Mesendoderm expression of pitx2 at 50% epiboly. (A) Wild-type embryo. (B) spt and (C) oep mutant embryos. Animal pole views are shown with dorsal to the right. (D-I) Dorsoanterior views with the anterior at the top showing the prechordal plate expression of pitx2 at 80-90% epiboly. (D) Wild-type embryo. (E) igu, (F) spt, (G) sur, (H) cycb229 and (I) oep mutant embryos. EXPRESSION / LABELING:
|
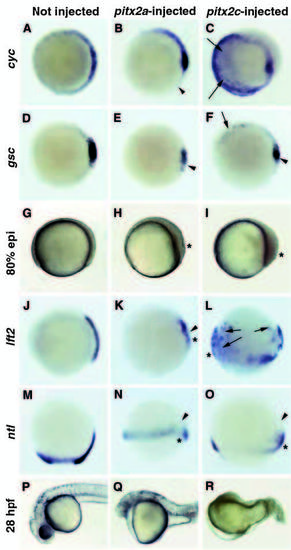
Ectopic expression of pitx2a and pitx2c disrupts mesendoderm formation. Embryos were injected at the 1-2 cell stage with RNA. (A,D,G,J,M,P) Control or uninjected embryos. (B,E,H,K,N,Q) pitx2a-injected embryos. (C,F,I,L,O,R) pitx2c injected embryos. (A-C) Expression of cyc at 40% epiboly; animal pole views with dorsal to the right. (B) pitx2a-injected embryo with arrowhead marking reduced expression of cyc in the margin. (C) pitx2c-injected embryo with arrows marking regions of increased cyc expression. (D-F) gsc expression at 40% epiboly; animal pole views with dorsal to the right. (E) A reduced number of cells with gsc expression in a pitx2a-injected embryo (arrowhead). (F) pitx2c injected embryo with less gsc positive cells on the dorsal side (arrowhead) and ectopic activation of gsc expression in other marginal cells (arrow). (G-I) Lateral view of embryos at 80% epiboly. (G) Control embryo with dorsal to the right. (H,I) pitx2aand pitx2c-injected embryos displaying slowed epiboly and excess cells at the blastoderm margin (asterisks). (J-L) Expression of lft2 at 80% epiboly. (K,L) Asterisks mark an increased number of cells at the margin, arrowhead shows reduced expression, and arrows designate regions of ectopic expression of lft2. (M-O) Expression of ntl/brachyury at 80-90% epiboly. (M) Control embryo with dorsal to the right. (N,O) pitx2a- and pitx2c-injected embryos displaying slowed epiboly and a lack of dorsal accumulation of ntl (arrowheads). Asterisks mark an increased number of cells at the margin. (P-R) Lateral view of 28 hpf embryos with anterior to left. |
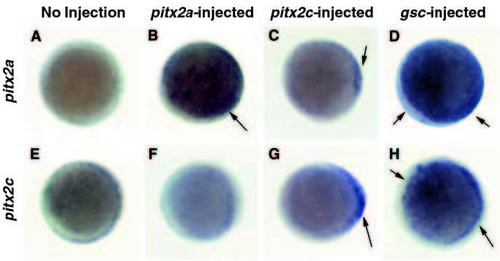
Ectopic expression of pitx2a, pitx2c and gsc affects the expression of pitx2a and pitx2c at 30-40% epiboly. (A,E) Control embryos. (B,F) pitx2a-injected embryos. (C,G) pitx2c injected embryos. (D,H) gsc-injected embryos. Embryos were analyzed for gene expression by in situ hybridization. (A-D) Expression of pitx2a mRNA (5′-UTR probe). (E-H) Expression of pitx2c mRNA (5′-UTR probe). Animal pole views are shown in all panels. Arrows designate regions of increased expression. |

pitx2a and pitx2c are differentially expressed during the asymmetric development of the diencephalon, gut and heart. In situ hybridizations at 22-25 somites of development using a full-length pitx2 probe (A,D,G,J), a pitx2a isoform specific probe (B,E,H,K) and a pitx2c isoform specific probe (C,F,I,L). (A-C) Lateral views with arrows pointing to asymmetric expression in the dorsal diencephalon, the developing heart and gut from anterior to posterior. (D-F) Frontal views; arrows mark left-sided asymmetric expression in the dorsal diencephalon. Both isoforms were expressed symmetrically in the ventral diencephalon. (G-I) Dorsal views with arrows marking left-sided expression in the developing gut. (G-I) Double in situ hybridization with pitx2 or pitx2-isoform specific probes (blue) and lft2 (red) probes showing asymmetric expression of pitx2 and lft2 in the heart field. EXPRESSION / LABELING:
|