IMAGE

Fig 2

ID
ZDB-IMAGE-210422-14
Source
Figures for Sutton et al., 2021
Image
Figure Caption

Fig 2 Analysis of <italic>S</italic>. <italic>aureus</italic> muropeptide profiles in different growth conditions.

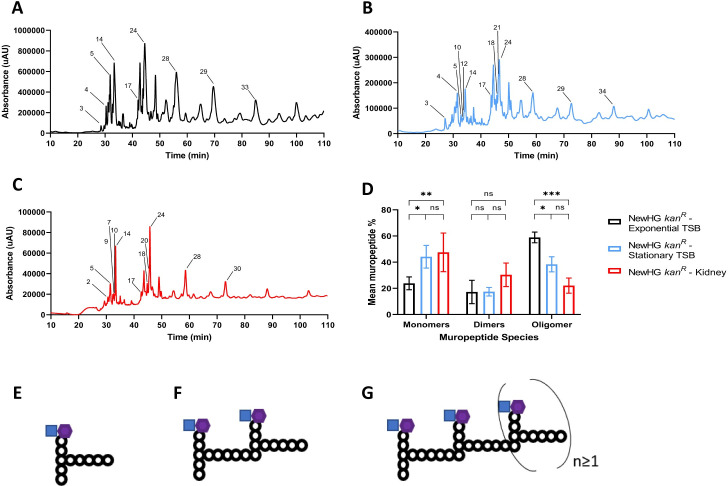
Representative muropeptide profiles of NewHG kanR (SJF 3680) cultured in TSB in (A) exponential phase (OD600 ~0.6) or (B) stationary phase (OD600 ~9). Muropeptides have been labelled after being identified by MS (S1 Table) (C) Representative muropeptide profile of NewHG kanR (SJF 3680) recovered from murine kidneys 72 hpi. Identified muropeptides are labelled using muropeptide numbers from S3 Table. (D) Area of eluted identified UV-absorbing peaks shown as a percentage of the total of all identified peaks grouped based on cross-linking (exponential phase TSB—black bars n = 3, stationary phase TSB–blue bars n = 3, NewHG kanR recovered from murine kidney–red bars, n = 2 independent experiments, each consisting of 10 mice, error bars represent the standard deviation of the mean). A two-way ANOVA with Sidak’s multiple comparison post-test was used to compare abundance of each muropeptide species (monomers * p = 0.0108, ** p = 0.0081; oligomers * p = 0.0101, *** p = 0.0002). Representative generic muropeptide structures, (E) monomeric, (F) dimeric and (G) oligomeric.

Acknowledgments
This image is the copyrighted work of the attributed author or publisher, and ZFIN has permission only to display this image to its users. Additional permissions should be obtained from the applicable author or publisher of the image. Full text @ PLoS Pathog.