
|
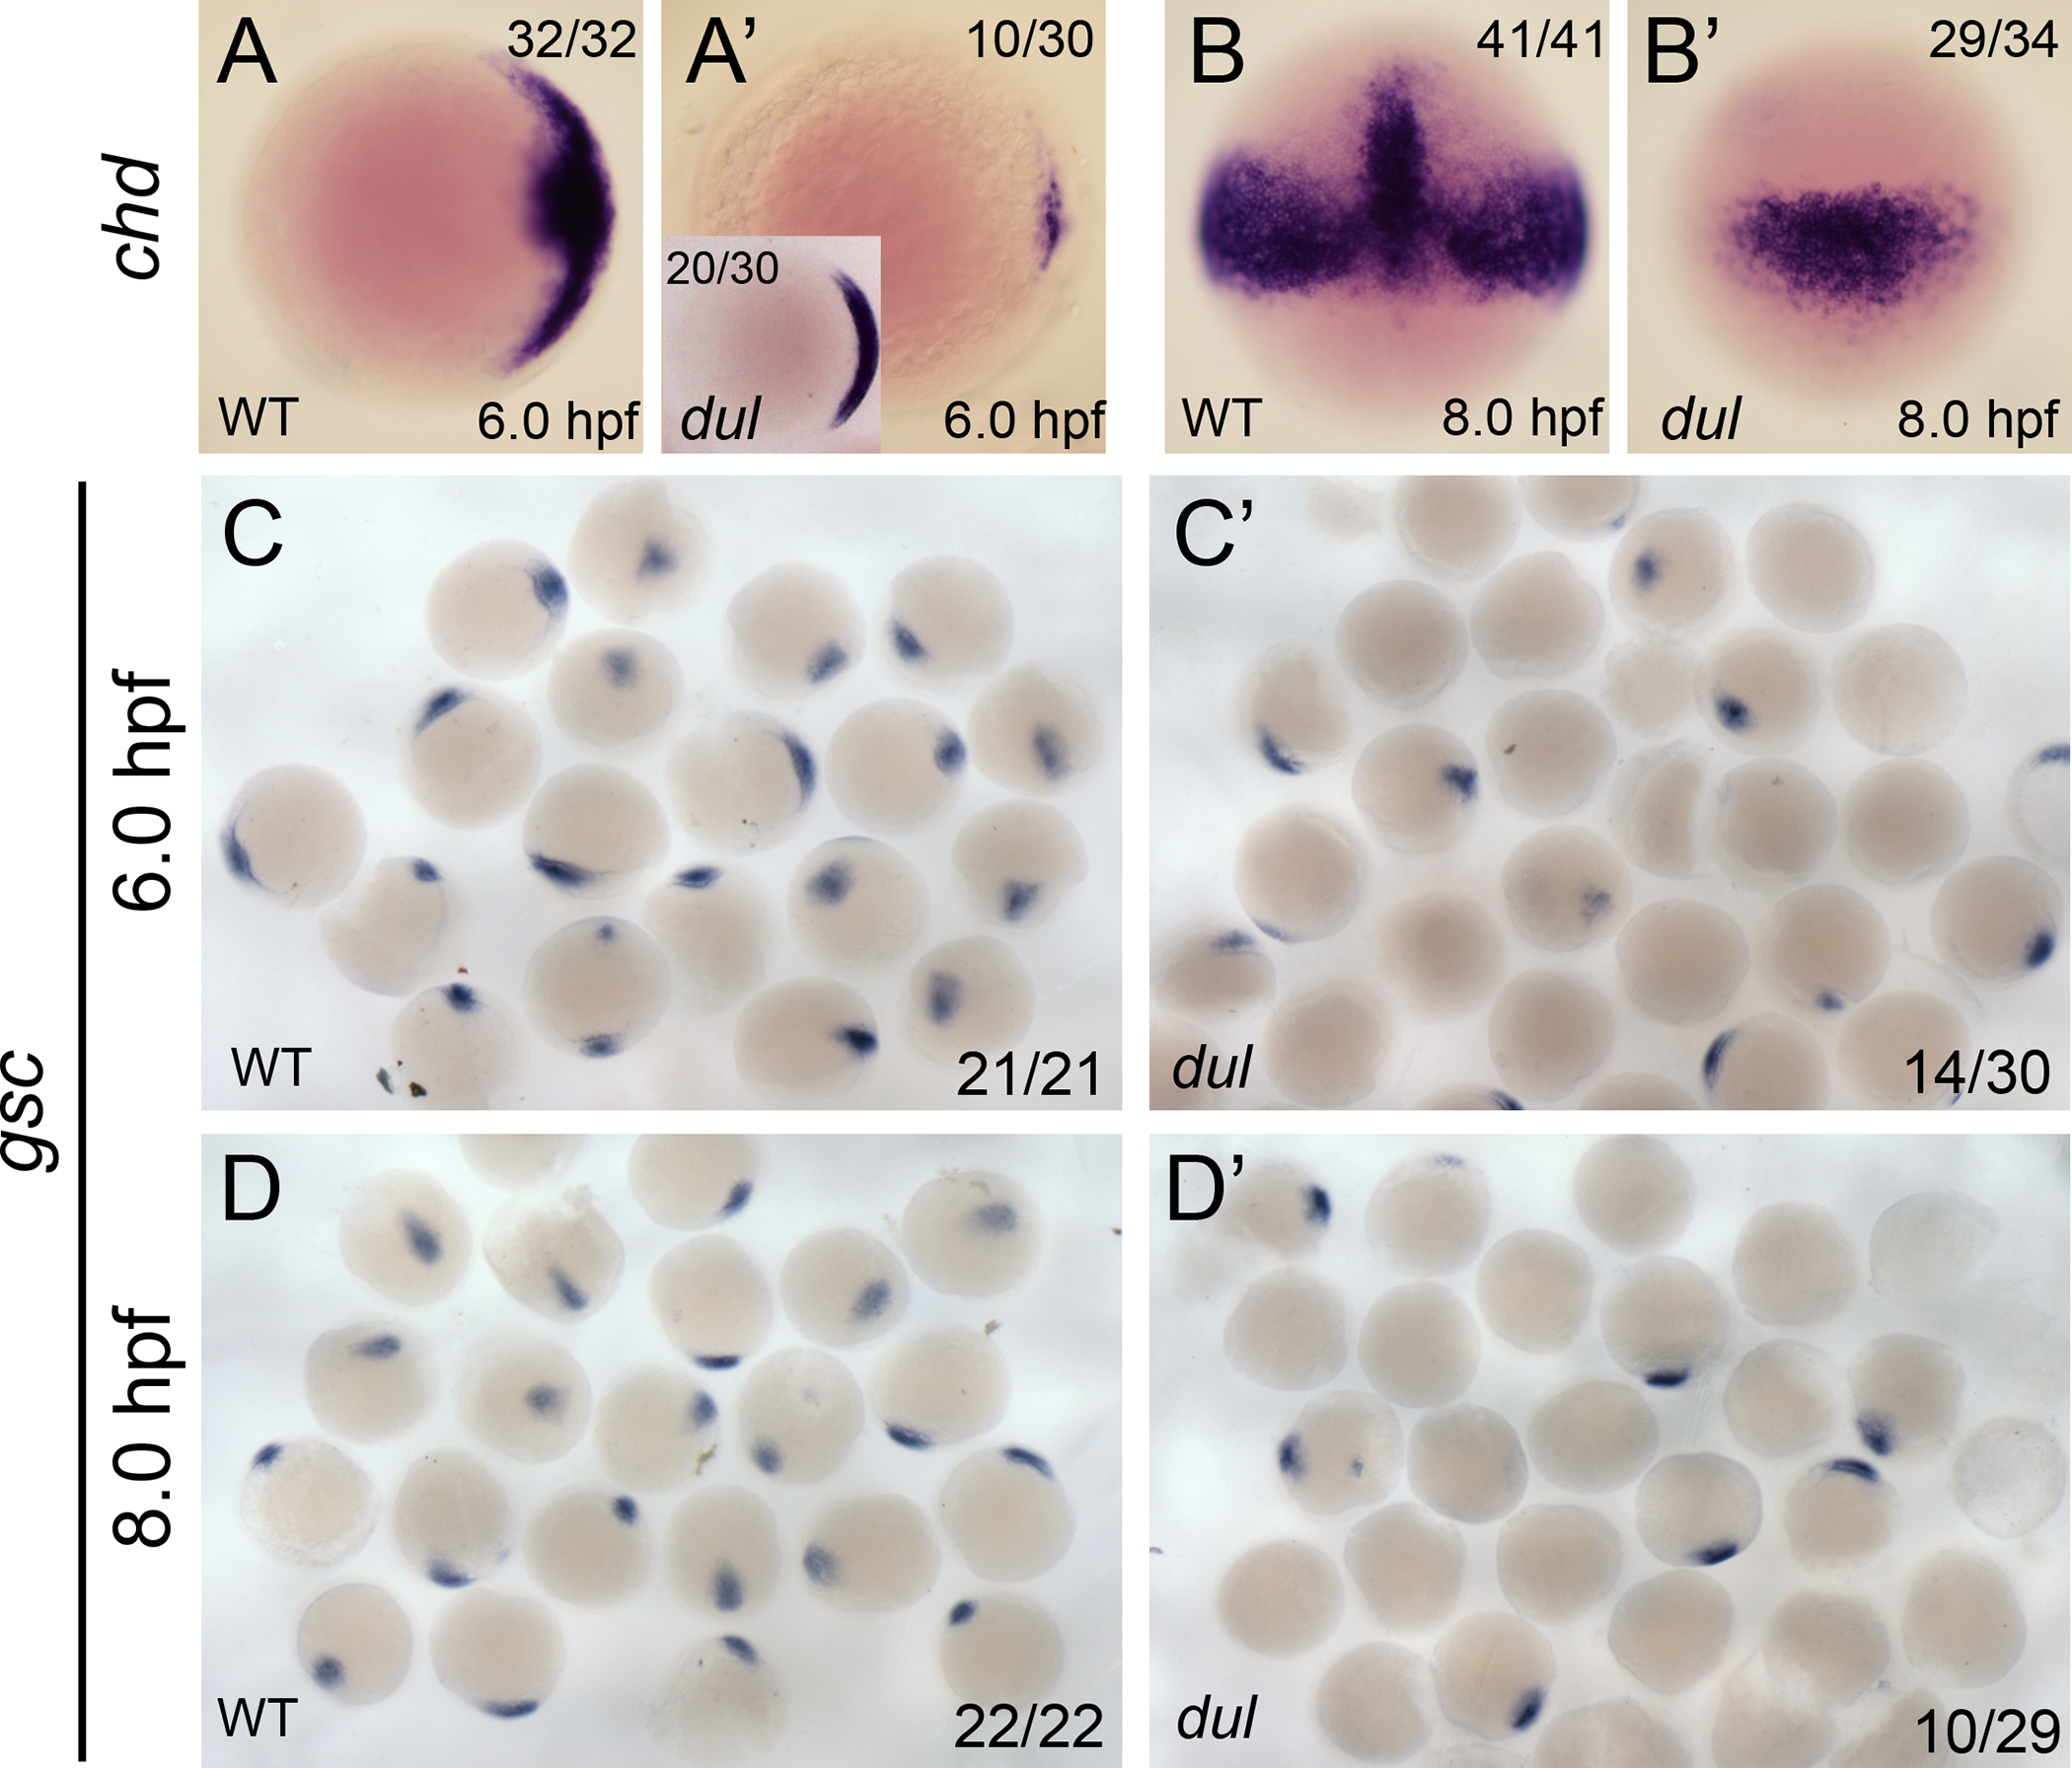
Fig. 6 Dorsal markers are reduced in dullahan mutants. chordin mRNA expression in wild-type (A, A’) and dul (B, B’) embryos at 6.0 and 8.0 hpf, respectively. A and A’ are animal views, dorsal to the right. B and B’ are dorsal views. The number of embryos with the shown expression pattern of the total embryos examined is indicated in the upper right or left (inset) corner. goosecoid mRNA expression in wild-type (C, C’) and dul (D, D’) embryos at 6.0 and 8.0 hpf, respectively. The numbers in the lower right corner indicate the number of embryos with any positive goosecoid signal of the total embryos examined.