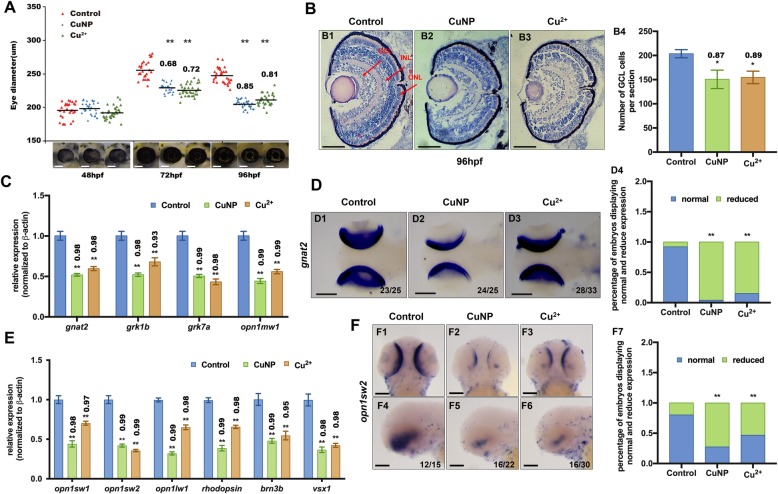
Image
Figure Caption

Fig. 1

Retinal developmental defects in copper stressed embryos. A Measurement of eye diameter of the embryos from control, Cu2+- and CuNPs- stressed groups at 48 hpf, 72 hpf, and 96 hpf, respectively. B H&E staining analysis of retina of embryos from control (B1), Cu2+-stressed (B2) and CuNPs-stressed groups (B3) at 96 hpf. Control embryos at 96 hpf developed normal retina with a differentiated GCL (ganglion cell layer), an INL (inner nuclear layer), and an ONL (outer nuclear layer) (indicated by the red arrows). (B4) Average number of GCL cells per section/per embryo in each group (n > 3, 3–5 sections from each embryo were used for counting the GCL cells). C Expression of retinal marker genes gnat2, grk1b, grk7a, and opnlmw1 in embryos from control, Cu2+-stressed, and CuNPs-stressed groups. D WISH data of gnat2 in embryos from control, Cu2+-stressed, and CuNPs-stressed groups, respectively (D1-D3), and the percentage of embryos exhibiting reduced expression in different groups (D4). E Expression of retinal marker genes opn1sw1, opn1sw2, opn1lw1, rhodopsin, brn3b, and vsx1 in embryos from control, Cu2+ − stressed, and CuNPs-stressed groups. F WISH data of opn1sw2 in embryos from control, Cu2+-stressed, and CuNPs-stressed groups, respectively (F1-F6), and the percentage of embryos exhibiting reduced expression in different groups (F7). B1-B3, sagittal slides in eyes domain; D1-D3, dorsal view, anterior to the left; F1-F3, dorsal view, anterior to the up; F4-F6 lateral view, anterior to the left. Scale bar: A, B1-B3, and F1-F6, 100 μm; D1-D3, 200 μm **, P < 0.01; *, P < 0.05

Figure Data
Acknowledgments
This image is the copyrighted work of the attributed author or publisher, and ZFIN has permission only to display this image to its users. Additional permissions should be obtained from the applicable author or publisher of the image. Full text @ Cell Commun. Signal.