
IMAGE
Fig. 3
Image
|
Figure Caption
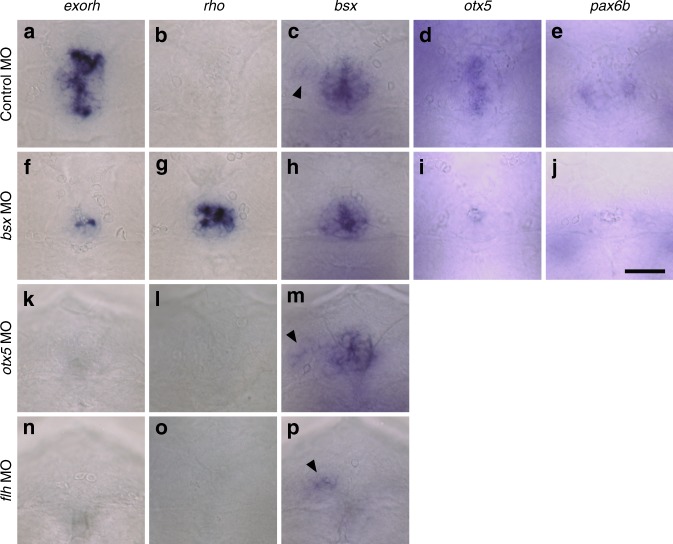
Fig. 3
Effects of depletion of Bsx, Otx5 or Flh on the pineal gene expression at 48 hpf.
Figure Data
Acknowledgments
This image is the copyrighted work of the attributed author or publisher, and
ZFIN has permission only to display this image to its users.
Additional permissions should be obtained from the applicable author or publisher of the image.
Full text @ Commun Biol