
|
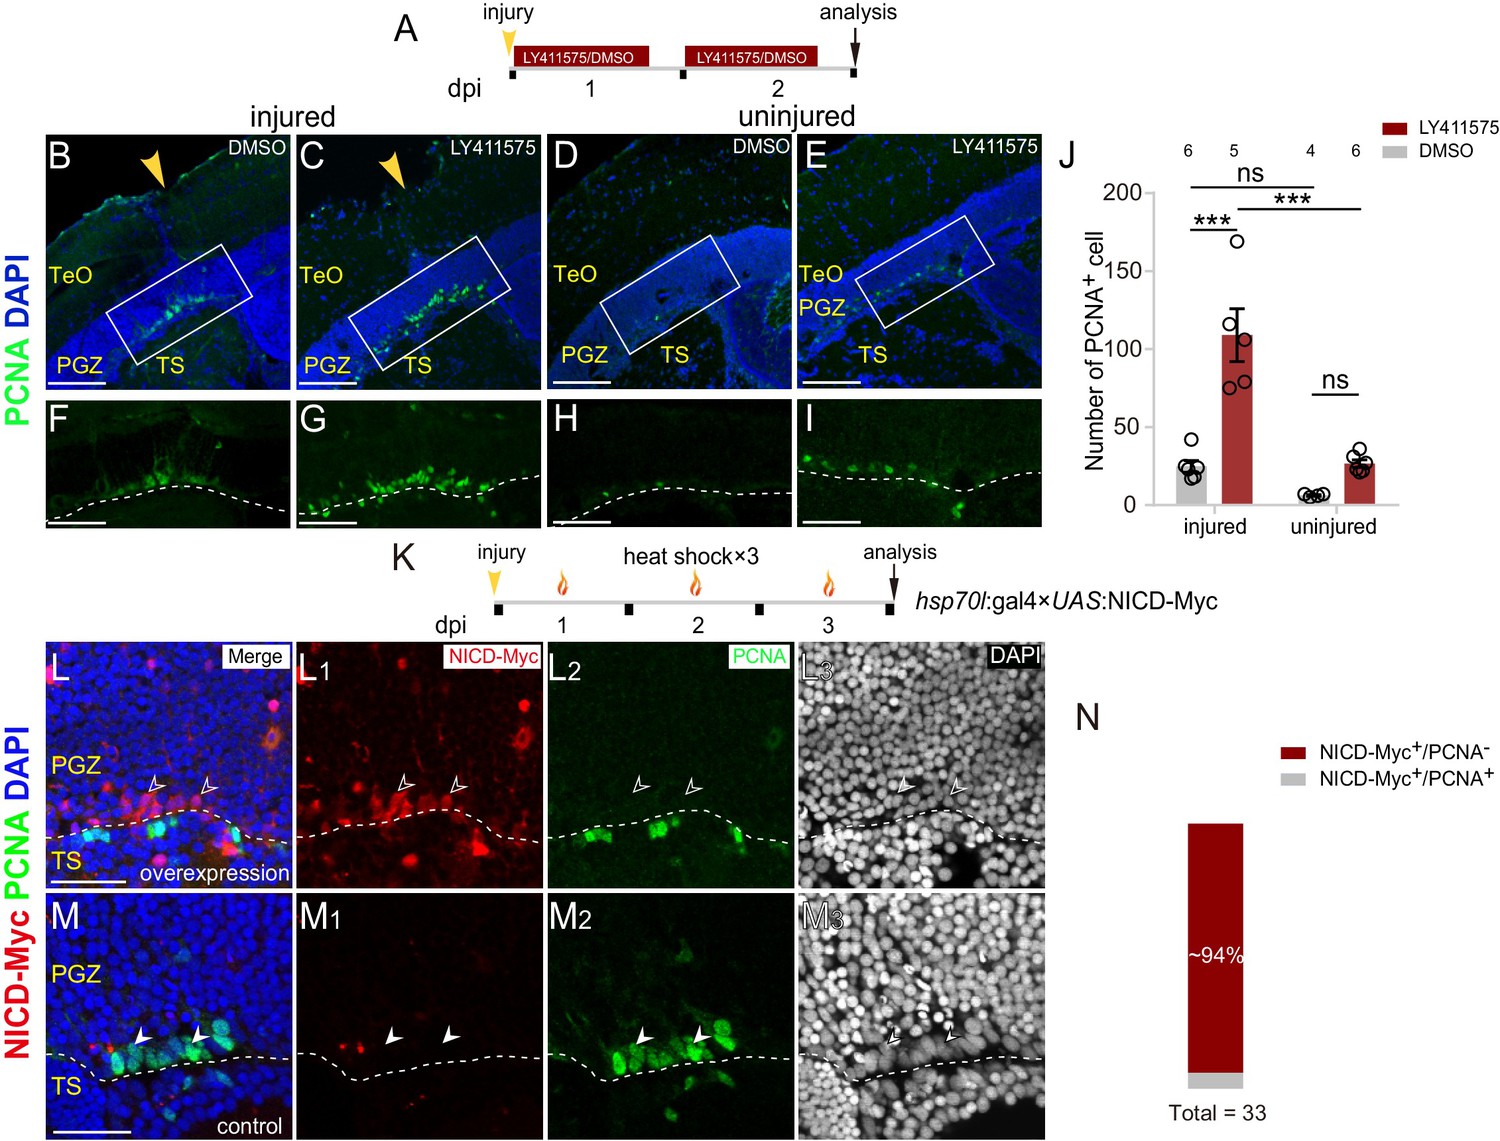
Fig. 5
Notch inhibition mediates the proliferation of reactive tectal RG.
(A) Experimental time course of Notch inhibition experiments shown in (B–I). Fish are administrated with LY411575, a Notch inhibitor, or DMSO for two consecutive and are analyzed at 2 dpi. (B–I) LY411575 administration increases the number of proliferative RG (PCNA+, green cells) underneath the injury site in the optic tectum with (B and C) or without injury (D and E). (F–I) The high-magnification images of boxed areas in (B–E). (J) Quantification of PCNA+ cell in (B–E). LY411575 administration significantly increases the number of proliferative RG (PCNA+ green cells) in the optic tectum with or without the injury. Very few RG is proliferative in the uninjured DMSO-treated control optic tectum (mean ± SEM; ***p<0.001, ns, p>0.05; two-way ANOVA followed by Tukey’s HSD test). See also Figure 5—source data 1 for quantification. (K) Experimental time course of heat shock-induced Notch over-activation experiments shown in (L–M3). Tg(hsp70l:gal4 ×UAS:NICD-Myc) fish are injured in the optic tecta and followed by heat shocks for three consecutive days (1 hr per day) and are analyzed at 3 dpi. (L–M3) NICD-overexpressed RG (open white arrowheads, red cells) underneath the injury site are not proliferative after the stab injury whereas RG (white arrowheads, green cells) become proliferative in the control optic tectum with the injury. The expression of NICD-Myc is controlled by the gal4-UAS system. It is a mosaic labeling genetic system so that only a subset of cells could be induced to express NICD-Myc. To avoid obscure the signal, only two representative cells were indicated by arrowheads in (L–M3). See also Figure 5—figure supplement 1C-C3. (N) Quantification of NICD-Myc+/PCNA− and NICD-Myc+/PCNA+ RG in (L–M3) showing ~94% NICD-Myc-overexpressed RG are PCNA−. (31/33 cells in 15 sections of 6 fish). The numbers above the bars indicate the animals used. White dashed lines represent the tectal ventricle boundary. RG, radial glia; TeO, tectum opticum; PGZ, periventricular gray zone; TS, torus semicircularis. Scale bars, 100 μm (B–E); 50 μm (F–I); and 30 μm (L–M3).