
|
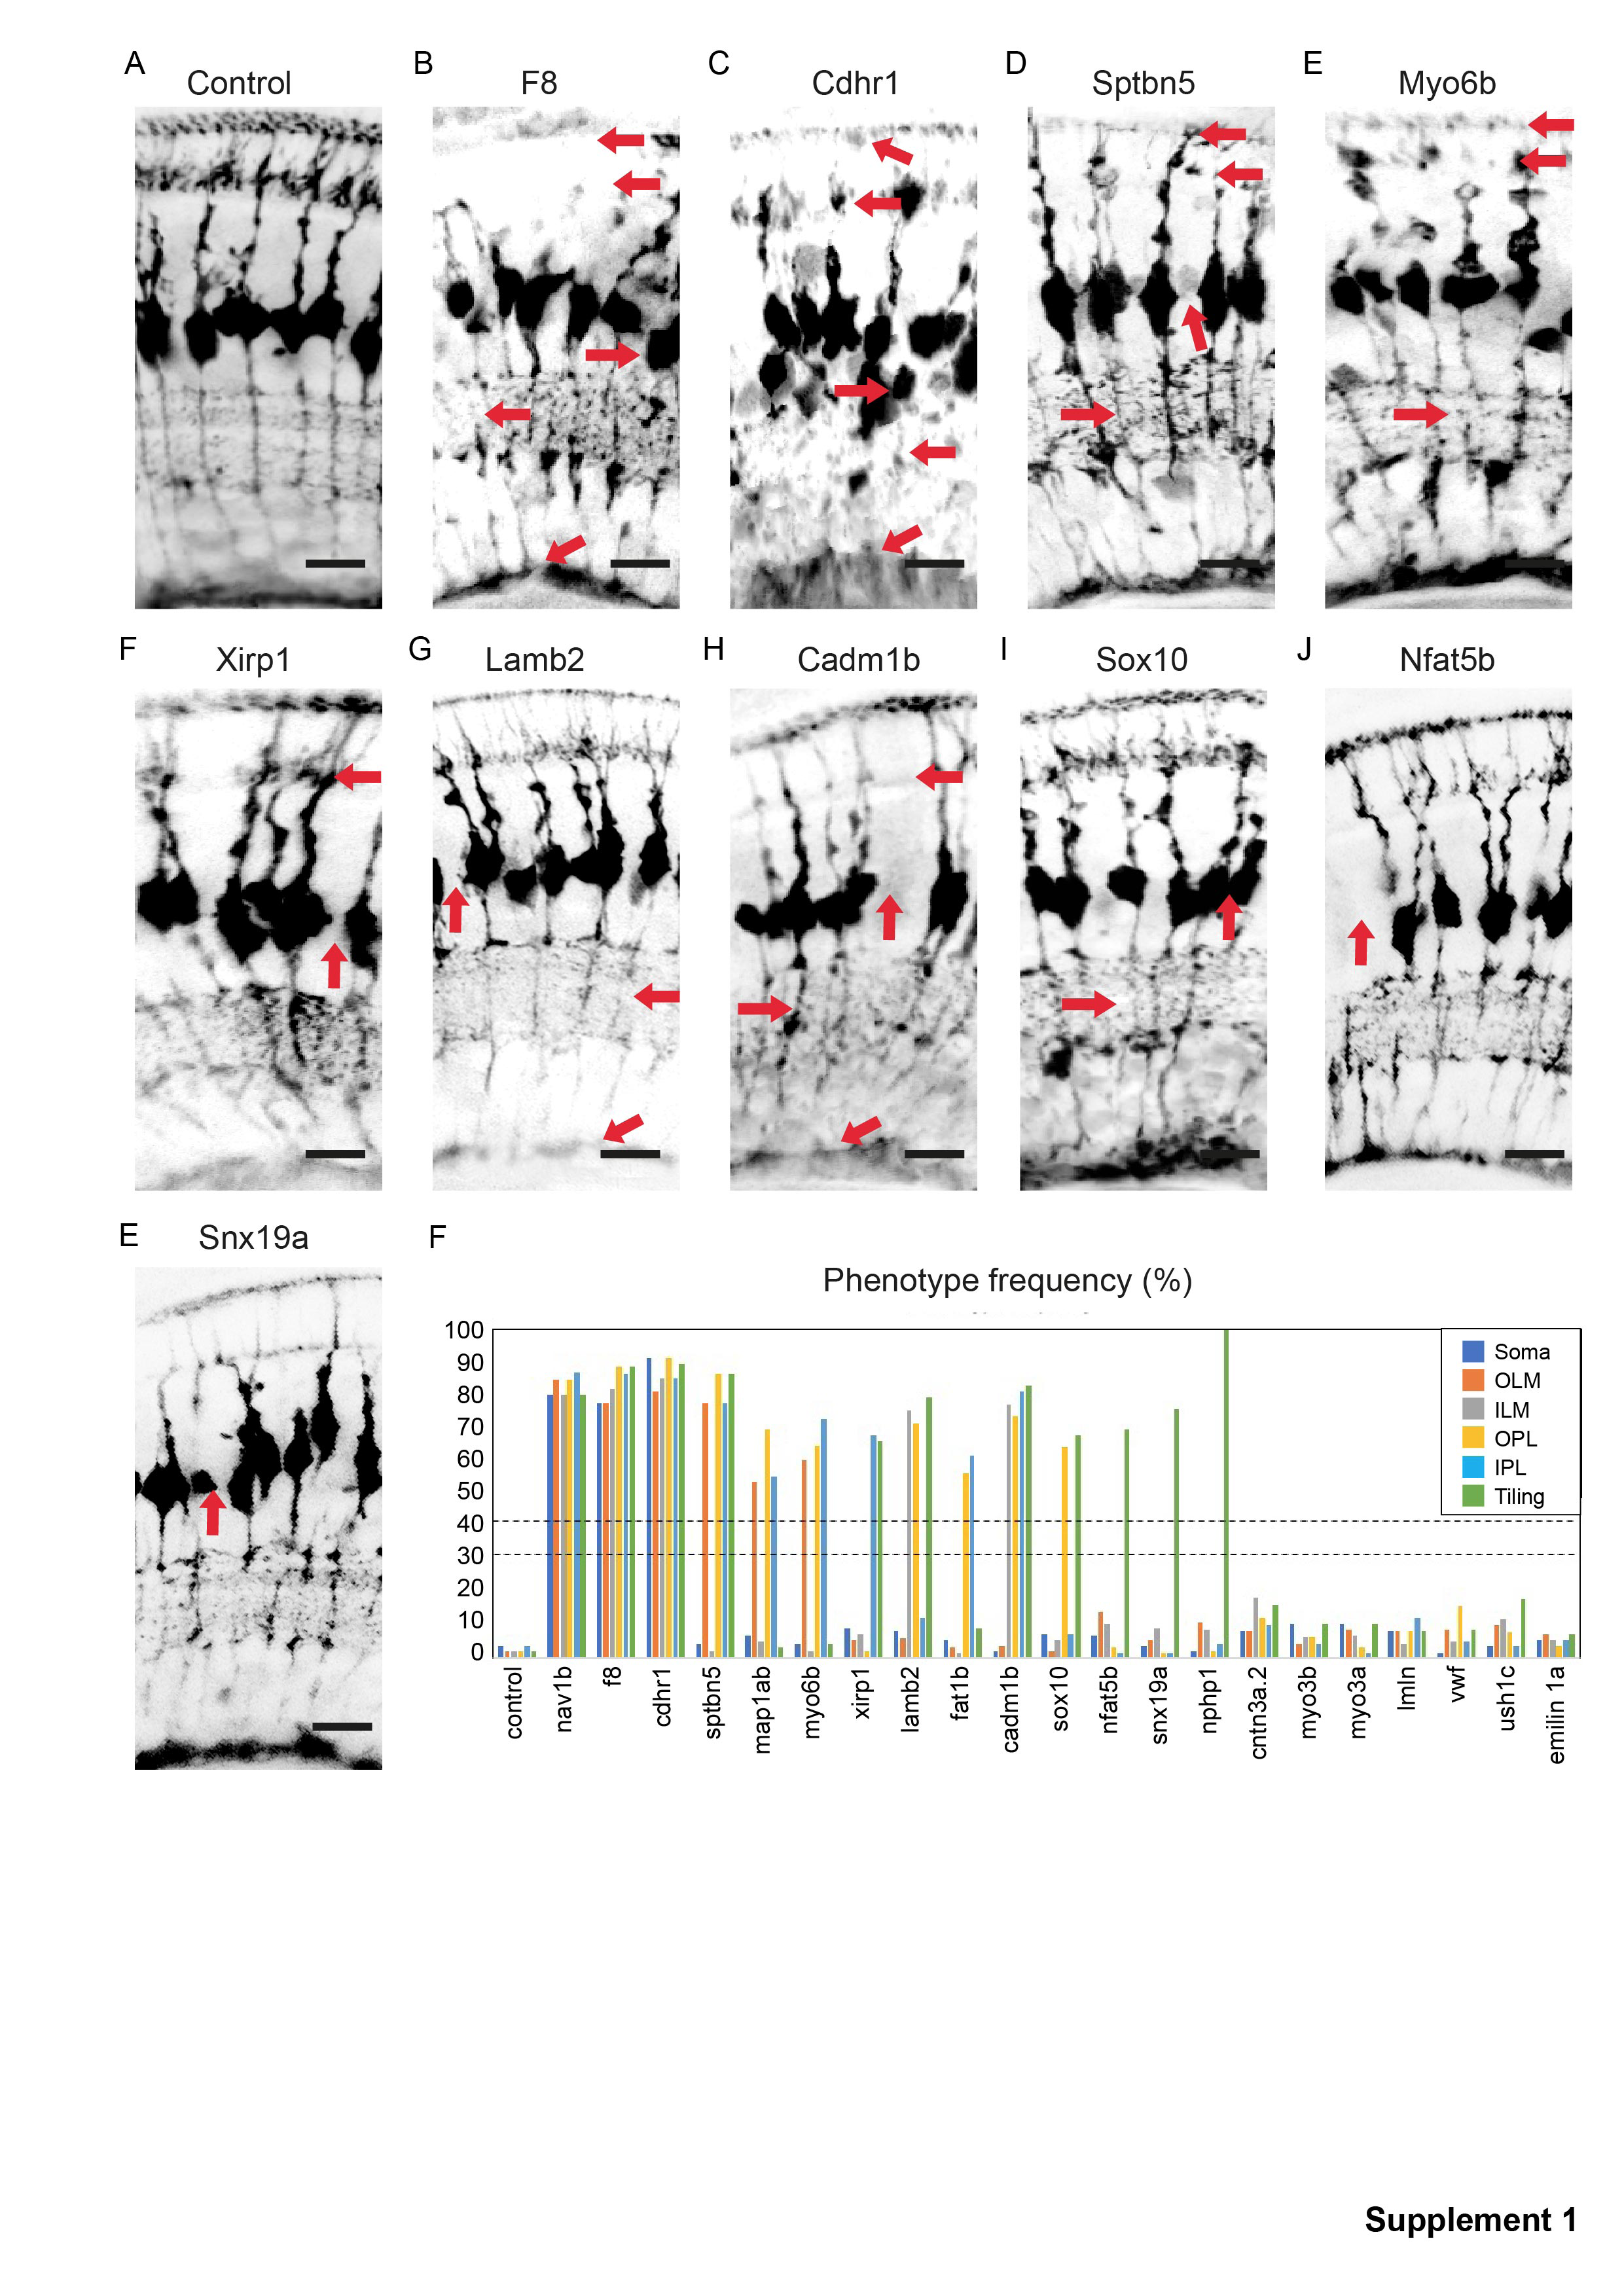
Figure S1
Phenotypes of gene mutants enriched over windows of MG cell differentiation. (a) slc45a5 controls have no observable MG phenotype. (b) f8 mutants have defects in cell body position, OLM, ILM, IPL, OPL, and tiling. (c) cdhr1 mutants have defects in cell body position, OLM, ILM, IPL, OPL, and tiling. (d) sptbn mutants have defects in OLM, IPL, OPL, and tiling. (e) mapa1b mutants have defects in OLM, IPL, and OPL. (f) xirp1 mutants have defects in OPL and tiling. (g) lamb2 mutants have defects in ILM, IPL, and tiling. (h) Cadm1b mutants have defects in ILM, IPL, OPL, and tiling. (i) sox10 mutants have defects in IPL and tiling. (j) nfat5 mutants have tiling defects. (k) snx19a mutants have tiling defects. (l) Percentages of individual phenotypes observed in all animals from this screen. Dashed lines represent levels of significance from Fisher's exact test after Boniforni multiple test correction (bottom = p < 0.05, top = p < 0.001). Scale bars = 8μm.