
|
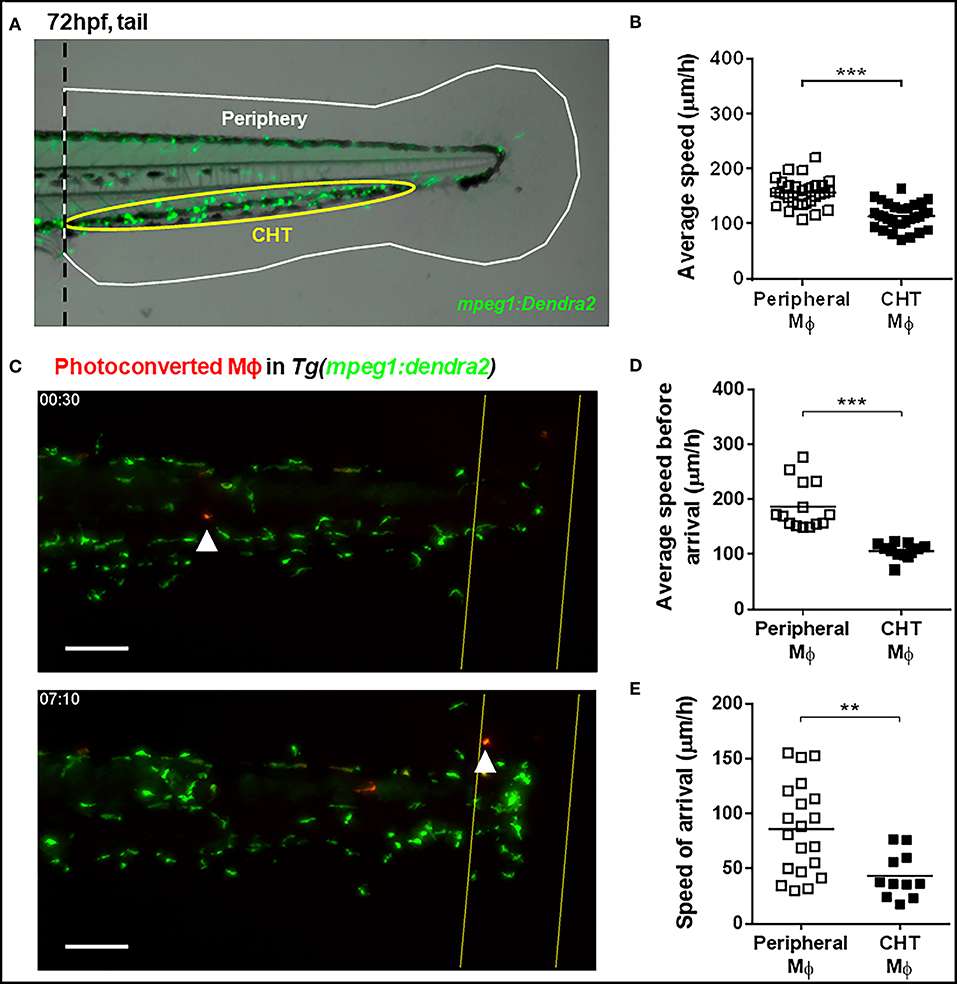
Fig. 1
Kinetic differences between peripheral tissue-resident and CHT-resident macrophages in steady state and after damage. (A) At 72 hpf, macrophages in the Tg(mpeg1:Dendra2) reporter line were classified as peripheral tissue-resident macrophages (white area) or CHT-resident macrophages (yellow area). (B) Average speed of peripheral and CHT macrophages (Mϕ) in steady state conditions. A tail portion of Tg(mpeg1:Dendra2)larva was imaged every 3 min for 3 h. (C) Time lapse imaging of photoconverted macrophages recruited to the damaged site in Tg(mpeg1:Dendra2) larvae. The photoconversion was performed before damage, and the complete tail region was captured every 5 min for a total of 24 h. Representative images showing a peripheral macrophage (white arrowhead) in the start of the time lapse (upper image), and at the time of recruitment to the damage site (lower image). Scale bar = 50 μm. (D) The average speed and (E) the speed of arrival of individual photoconverted macrophages. A total of 14 peripheral macrophages and 12 CHT macrophages from a pool of photoconverted individuals were used for the analysis. **p < 0.01; ***p < 0.001.