
|
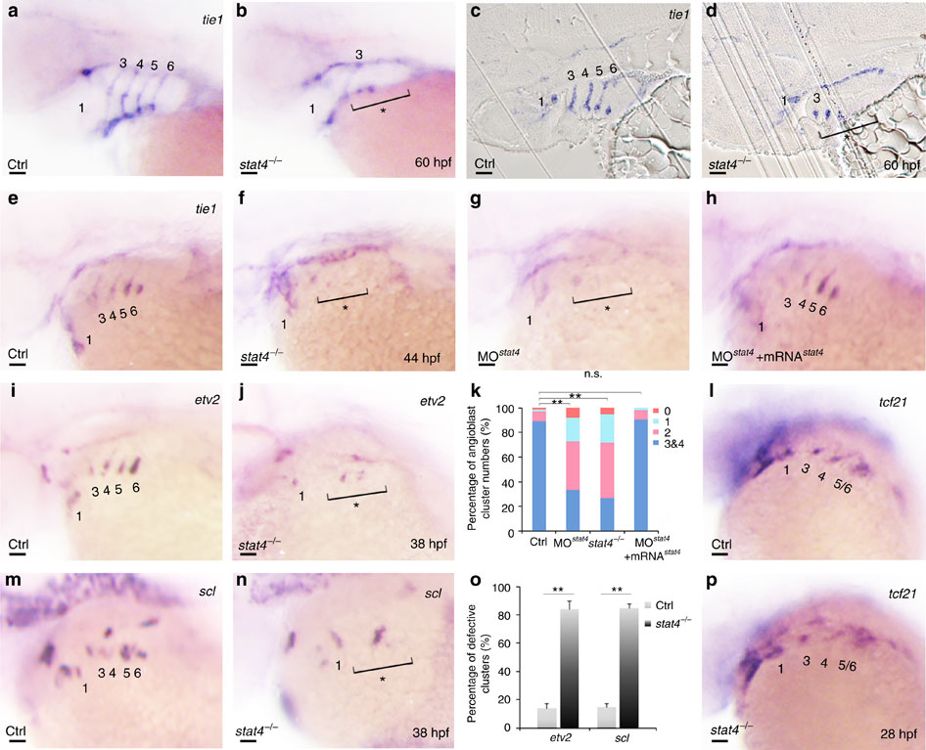
Fig. 3 Lack of stat4 represses emergence of PAA angioblasts.
(a,b) tie1 transcripts expressing PAAs are visualized in the control and stat4 mutants at 60 hpf. (c,d) Resin sections (10 μm per section) of wild-type and stat4 mutant embryos with tie1 in situ hybridization at 60 hpf. (e–h) Analysis of tie1 expression in pharyngeal angioblastic cords is conducted in the control embryos (e), stat4 mutants (f), stat4 morphant embryos (g) and embryos with stat4 mRNA and stat4 morpholino injection (h) at 44 hpf by in situ hybridization. (k) Proportional quantification of embryos with defective PAA angioblast cords in tie1 staining assays, Kruskal–Wallis test with the Dunn’s multiple comparison test, **P<0.01, n.s.: P>0.05. (i,j,m,n) The etv2 and scl transcripts are evaluated by in situ hybridization in the control and stat4 mutants at 38 hpf. (o) Percentage of embryos with defective PAA angioblastic cords in etv2 and scl staining assays, error bars indicate the s.d., Kruskal–Wallis test, **P=0.0058, n=30 per each group. (l,p) tcf21+ PAAs are visualized in the control and stat4 mutants at 28 hpf. Scale bars, 50 μm. a–d, n=23 embryos in each group; e–h, n=32 embryos in each group; l,p, n=26 embryos per group.